![ITONICS-Logo-Night-Blue-2021.svg]](https://www.itonics-innovation.com/hubfs/ITONICS-Logo-Night-Blue-2021.svg)
1. Discover (un-)related content via the Workspace's Network Graph
2. Discover (un-)related content via one Content Element's Network Graph
Discover (un-)related Content via the Workspace's Network Graph
The ITONICS Network Graph is a graphical representation of all the relations between the content elements in one workspace. To enter the Network Graph, you will find the respective menu item in your left main navigation menu.
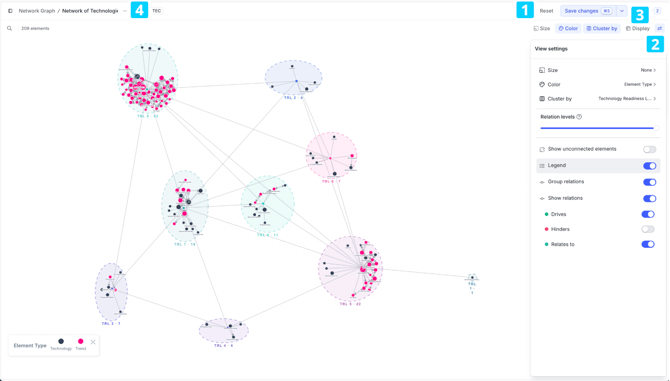
Once you have entered the Network Graph, you can adjust the content displayed by the search and filter menu at the top of your screen [1]. Drill the view down to any specific element types, publication status, or more advanced filters.
Furthermore, you can adjust how the graph is displayed from the toolbar at the top — Size, Color, Cluster by, and Display — and from the View settings panel [2]. This way you can:
- Size: choose what the dots' size represents, e.g., a rating criterion such as Potential Impact. Elements with the most relations appear as the biggest dots, and their titles are displayed first.
- Color: choose what the dots' color represents, e.g., the publication status or any rating criteria values.
- Cluster by: group the graph by any property, including tags. All elements that share the same value of the chosen property are grouped together into a cluster. Route each cluster’s links to other clusters through a single dot at the center of the cluster, dramatically cutting the number of outgoing lines between clusters.
- Cluster size depends on element spacing and dot size, not the number of elements. Cluster by controls grouping, while Size by controls dot size.
- Relation levels: set how many levels of related elements are loaded into the graph beyond your filtered set — 0 shows only the filtered set, 1 also loads everything those elements reference, 2 adds their references (sub-sub relations), and so on.
- Show unconnected elements: include elements that have no relations set; by default, all unconnected elements are shown.
- Legend: show or hide the color legend in the bottom left of the screen.
- Show relations: switch each relation type (for example Drives, Hinders, and Relates to) on or off individually; each relation shows in the color configured for that relation property (set in the element configuration), matching the connecting lines in the graph.
- Group relations: collapse multiple relations between the same two elements into a single line, labeled with the number of relations — far less clutter in densely connected graphs.
Each content element is displayed by one dot in the Network Graph. If a relation is set between two content elements, it is displayed by a line between these content elements. If no connection has been made, no line is shown. You can activate "show unconnected elements" from the settings menu.
To save a new configuration, find the "save changes" or "save as new view" option at the top right [3]. When "saving as new view", a modal opens where you can indicate the title of the view. You can also create a new view when clicking on the title of the current network graph view and select "create view" [4]. Here, you also find an option to determine whether it is a private view or you want to share it publicly with the other workspace users.
Next to the title, you find three dots from which you can:
- Copy link
- Open in a new tab
- Add to favorites
- View settings: Rename the view, allocate to a different folder, set public/private
- Export view to Excel
- Duplicate view
- Duplicate as
- Delete view
You can also zoom in on the Network Graph. You can use your mouse wheel or the control options to the top right. You can also use double-click to zoom in. Zoom is semantic: at a high level, relations are grouped so you see the overall structure first, and as you zoom in each group expands to reveal more detailed connections.
To search for specific relations, you can also use the filters. Choose the respective relation property and filter the view for Relation is, Relation is not, or Relation is empty.
Discover (un-)related Content via one Content Element's Network Graph
Each content element comes with its own Network Graph. Click on one content element and navigate to the relation section [6]. By default, you will find the relations listed in the list view. However, you can change the view to the network graph view [7].
The relations are now displayed visibly, and the color indicates the element types (as defined in the element configuration). Besides direct relations, i.e., a relation that is set between two content elements, the graph also visualizes second-level relations, i.e., potentially interesting relations that emerge because already related content has relations with other content elements [9]. To make this more visible, you can manipulate the settings [8].
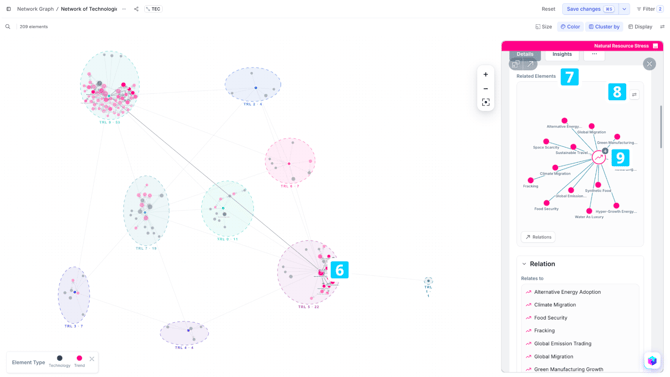
By changing the sliders, you can define how big the dots of the first-line relation and the second-line relation should appear. The same can be applied to the distance level between the elements of the first- and second-level.