After you successfully log in to the ITONICS platform, you will land on the default view. On the left side of the screen, you can see the main menu to navigate the system. This menu consists of six sections:
- Workspace Picker (switch between workspaces) & Workspace-, Organization-, Profile-settings
- Create — add content of any element type
- ITONICS tools
- Workspace views
- Help & support
- ITONICS Prism

1. Workspace Picker
Your Innovation OS is designed to engage multiple teams and stakeholders with different interests on one single source of truth. Workspaces thus allow you to provide each of these groups with different (content) interests with their own home.
When you are allowed to access different workspaces, they will be listed here. Simply click on the name of the current workspace and click on the name of another workspace to enter it.
You can learn more about the creation and administration of workspaces in this article.
User Profile and Settings
You can view and manage your profile, including your account information, workspace informmation, and organization details from here.
Read more on what you can do here.
2. Create
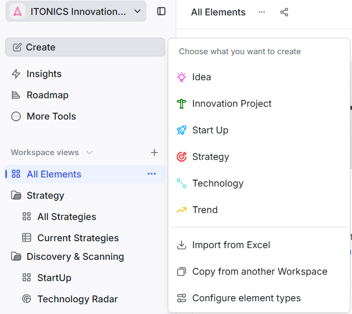
When you want to intake content, the create button is the easiest option to enter single content intakes.
After clicking on "Create", you are asked to choose the type of content that you want to create.
This selection depends on the element types that your workspace administrators have made available to you.
You are asked to enter a title, a summary and the remaining must-have values.
By clicking the check box "create another", the first content element will be created, and the model will open again so that you can enter more content.
Further, you can define the publication status. If you want to save it as a draft, click the respective button. If you want to publish it directly and make it available to the other users, simply click Publish.
To learn more about all the options of how to intake single and bulk content elements, read on in this article.
3. The ITONICS Tools
Below the "Create" button the three-dot-menu, "More Tools", is located.
Hiding behind these three dots are the key features "Insights", "Report", "Roadmap", "Processes", and "Sites".
To pin them to the side menu for easy access, press the pin icon next to the name of the tool, this will pin the tool only for you.
-
Insights (read more)
Insights utilizes natural language processing technology to return relevant information from the ITONICS data lake, consisting of various sources (incl. news, patents, scientific publications, and companies). It eases scouting activities by returning similar relevant inspirations and drafting time series charts of signal development. -
Report (read more)
ITONICS reports allow you to embed more fine-grained analysis, reports, and dashboards from business intelligence tools into your ITONICS Innovation OS. As part of the process, you can send information from ITONICS to those applications, craft your report, and embed those into your system. -
Roadmap (read more)
The ITONICS roadmap helps you to both master strategic planning as well as generate an overview across the innovation landscape. This could include (a) future markets you identified to be attractive, (b) products and services you are working on to address that future (or existing) markets, (c) technologies you need to order to bring those products and services to market by developing them in-house or (d) working with start-ups, universities, and corporate partners. All of which is plotted along a dynamic timeline. -
Processes (read more)
Model custom workflows with ITONICS processes to ensure proper governance. -
Sites (read more)
Start your open innovation journey by creating your first Site. Sites are access controlled, custom web pages that are tied to a workspace to enable external users (or only workspace users) to contribute to the, otherwise closed off, ITONICS ecosystem.
Please note that the display of these tools depends on your subscription plan.
To learn more, simply contact us at account_manager@itonics-innovation.com
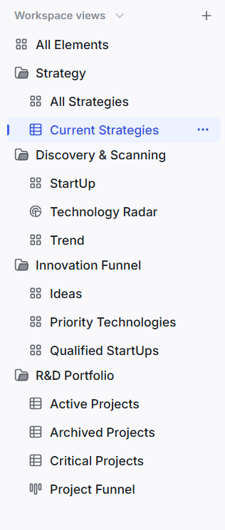
4. Workspace views
The real work gets done inside the different workspace views and folders.
Different to other innovation platforms, the ITONICS Innovation OS transitioned to a use case-based navigation structure with customizable folders and views.
This navigation allows for grouping content on a use case basis into folders and not having to rely on an old, cumbersome navigation structure.
Easy, fast, and efficient.
See in the picture on the right how a use case based navigation structure could look like.
Structuring views
The navigation is fully customizable, after adding a folder or a view of any kind (Radar, Matrix, Board, List, Grid, etc.) via the plus icon in the top right of the image, use drag-and-drop to place the view according to your needs.
Setting a landing page
The default landing page of a workspace is defined by the first view in the Workspace Views section. This view is used as the landing view for all users accessing the workspace via the standard workspace link, regardless of whether the view is located inside or outside a folder.
Note: If a user places a private view at the top of the Workspace Views section, this private view becomes the landing page for that user only, allowing them to define a personal landing view without affecting other users.
Different views explained
-
Grid (read more)
The Grid is the heart of the ITONICS application. In the Grid view "All Elements", you can find all the content that exists throughout a workspace. This includes published content as well as content that is archived, or in draft mode (check your filters). It thus serves as the easiest way to find content around specific topics (cf. the article on searching content or filter criteria).
-
Radar (read more)
The ITONICS Radar is the module for displaying a rich content landscape and understanding it easily by representing multiple characteristics simultaneously by the distance to the radar center, placement in a segment, color, halo, and donut.
-
Matrix (read more)
The ITONICS Matrix enables users to analyze, track, monitor, and re-evaluate a distinct set of content for decisions.
-
Table (read more)
ITONICS Table is an extension of the Explorer that allows you to see your content in the form of a table and with configurable columns, think of it as a different view. This way, you can edit content in bulk easily and as fast as possible. Furthermore, Tables come with their own dashboard capability, allowing you to analyze and present your content. -
Boards (read more)
The ITONICS Board is the module for displaying a content landscape that follows a certain process flow. It can, for instance, help you understand in what stage and status your project portfolio is. It is organized by rows and columns whereas each can represent a specific meaning. Furthermore, the color displayed on the card of a content element can represent a third dimension. More information can be put on each card. -
Network Graph (read more)
The ITONICS Network Graph enables you to get an overview of the relationships between different elements in one place. You can now identify hot topics or your unconnected dots. -
Pages (read more)
ITONCS Pages allow creating custom pages using HTML and use them as entry points within a workspace. Pages behave like standard views and can be placed anywhere in the workspace navigation. When positioned at the top of the navigation, a page automatically becomes the workspace landing page, providing users with immediate orientation and guidance upon login.
5. Help and Support
This navigation item allows you to contact the ITONICS support team.
Read more on what you can do here.
6. ITONICS Prism
Prism is ITONICS version of an AI powered, context aware chat based AI that lets you create elements from the Signals Pool and segment, and rate them for Radars and much more.
This is possible because ITONICS Prism is based on a multi-agent gen-AI architecture that can access everything you want it to.
Read more on what PRISM can do here.