Radar views can be accessed from the main navigation menu on the left side, only if your Application Owner has designed different radars. They will appear in their respective folders, where they have been placed by your workspace manager.
With the ITONICS Radar you can do a bunch of different things:
1. Displaying Content on the Radar
2. Adjusting the Radar Configuration (+ Saving it)
3. Saving, Sharing, and Adjusting Saved Radar Views
4. Auto-create Trend and Technology Radars
Displaying Content on the Radar
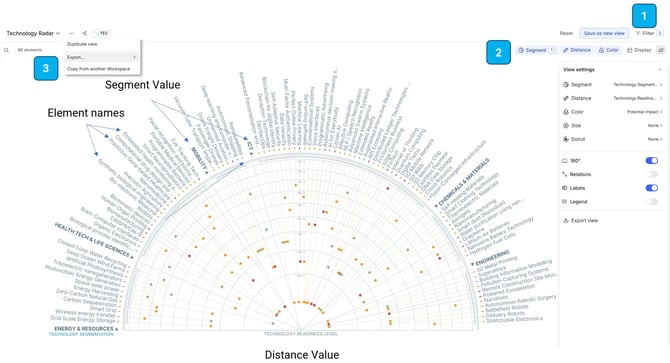
The content elements visible on the radar depend on the filter selection applied [1]. Any saved radar view in the left navigation menu thus represents a filtered and saved radar view.
Adjusting the content display
Think of the Radar as a view, it has a filter, to select the elements to be displayed, and a bunch of visualization settings to select how they will be displayed.
When you want to adjust the content displayed on any radar, find the filter section on the top right of the radar. From here, you can tailor the content displayed to any search request you have or the filters that you apply [1].
The radar is built based on the information present in each content element (and its configuration). The segmentation, color/size/donut, and distance to the center indication can be adjusted dynamically from the radar configuration menu [2].
That means that the visual indicators used on the radar can be used to represent each dropdown field or rating criteria that have been defined by your Application Owner.
If enabled, ITONICS also provides an automatically filled score (from "none" to "very high"), called Speed of Change, which holds an aggregation of the growth rate of news, patents, and publications related to the element.
To cover a short and mid-period of time, ITONICS provides two AI scores with different time ranges: Speed of Change [90 Days] and Speed of Change [180 Days]. When you use, for instance, Speed of Change [90 Days] on the radar as the distance criterion, it will display all the content relative to the changes of signals over the last 90 days.
If this is a view that you want to visit frequently or share with other users, you will find the option to save this view in the top right corner [1] - the radar view configuration will be saved alongside your filters applied. When you click save, you will be asked whether this view is for private usage only or whether it should be visible to all other users as well.
Please note that radar views that are accessible to every workspace user can only be created by Workspace Admins and Moderators.
Please note that longer titles are cut off after 25 characters.
Dive into the Segments
As the radar is a dynamic visualization, the radar view will also adjust when you click on the title of a segment. By clicking on it, the radar view will zoom into this specific segment. When you use sub-segments from the radar configuration menu [2], the display of the segment will now be organized against the sub-segment values.
You can also click on the segment circle line to dive into it. If sub-segments are available, this will also be visually represented by two or more circle lines.
Zooming into the Radar
You also have the option to zoom in/out on specific areas of the radar. For this, you can use either of the following options:
Option 1: Use the + and - buttons on the right side of the Radar to zoom in and out of the Radar.

Option 2: Use the mouse wheel to zoom in and out of the Radar.
Option 3: Double-click the Radar to zoom in.
Reset: The reset button is located below the zoom buttons. Click it to fit the Radar to layout size.
Maximize: The Maximize button is located above the zoom buttons. Click it to fit the Radar to the window size.
Adjusting the Radar Configuration
Any user can adjust the content that is displayed on the radar or the configuration itself, e.g., the meaning given to the segmentation, color, distance, size, or donut. Only the option to save views publicly and share with other users is restricted to Workspace Admins and Moderators.
To adjust the radar configuration, you can find the radar settings icon on the very right [2].
You can change the meaning of the:
- Segmentation: The segmentation defines the split of the radar into different parts. Each part will be displayed by its name (in bold) and the elements belonging. Click on "Segment" and choose from any of the available options. The radar slices will adjust immediately and display the elements for which a respective value has been entered before.
Within the available options, you can choose from the available single-choice dropdown fields, the rating criteria, the element type, and the publication status. You can combine two different fields: one as the first hierarchy option (first line segment by), and via "Add segment", you can add up to five more sub-segmentations.
Please note: If one of the segmentation values has not yet been set on any element, the slice will not be represented. Elements that have no value for the current configuration set will be displayed under the slice/category "unassigned".
Please also note that when you use a hierarchical dropdown field, you can create even more hierarchical levels. For hierarchical fields, you only need to select the name of the hierarchical field on one of the two "segment by" options, and the complete hierarchy will be plotted directly.
Please note that you cannot edit or extend ITONICS predefined blueprint segmentations. You can also only select from single-choice dropdown fields, thus; make sure not to tick the checkbox Allow Multiple Values in the Element Configuration. To create your custom segment fields, you need to be subscribed to ITONICS Professional for access to Element Configuration.
Contact us at account_manager@itonics-innovation.com if you need further information.
- Distance: The distance defines the plotting of each dot on the radar relative to the center of the radar. The different values of any rating criteria, single select field, or step field will be displayed as a circle around the radar's center, where each circle represents a different value. To change the current distance indicator, simply click on "Distance" and select your desired criterion.
- Color: The color can be used to give a specific, distinct color to each value of a criterion. For instance, if your criterion has five different values, each of these values can be displayed by a different color, making it easier to distinguish the values. To apply a different color coding, click on "color" and choose from the available options of rating criteria, single-select fields, or step fields. The color is to be defined in the Element Configuration and can be selected for each option of the respective property.
- Size: The size can be used to provide a specific meaning to the size of any dot. Each value will be represented by a different additional circle around the dot. For the size, rating criteria, and their values can be used. You will find it in the radar settings on the top right [2].
- Donut: The donut can be used to provide a specific meaning to the arc of any dot. Each value will be represented by a different arc size around the dot. For the donut, rating criteria, and their values can be used. You will find it in the radar settings on the top right [2].
- Relations: When you have enabled the relations view, the distance will disappear, and instead, the relations between the radar elements will be shown. When you have indicated different relation types, you can now define the colors by which the different relation types are displayed on the radar. Click on the settings icon to the very right, and a new menu will open where you can indicate your custom colors for each relation type [5].

In the settings, there are some further controls possible that can adjust the radar view:
- 180/360 Degrees: Switch between a 180- and a 360-degree radar visualization.
- Relations Mode: Activate the relations mode to only show relations between Elements. This will deactivate the distance display. When you now click on any content element on the radar, the relations of this element to other elements are highlighted. When you use different relation types, you can adjust the colors of the different relation types (See "Select colors for a relation type").
- Show/Hide Labels: Switch on and off the visualization of Element titles. So that you know, shown element titles are truncated after 27 characters.
- Export: Export a PNG image of your current radar view at 72 dpi. The bigger your screen's resolution, the better the image resolution will be [3].
- Show/Hide Legend: When you use color, halo, or donut, the legend will show the meaning of each distinct value and visual indicator.
Saving, Sharing, and Adjusting Saved Radar Views
Once you have created a radar view, incl. the content displayed and the radar configuration, you have the option to save this view so that you can come back to this view more easily or make it available to other users.
To create a new saved radar view, go to the right side and find the option "Save as new view" [6] or, when you want to create a completely new view, go to the left, click on the name, and select "Create view" [4].
Via "Save as new view", you will save the view with a new name.
When you click, a pop-up appears where you are asked to provide a title for this view [7]. Afterward, you can directly save it, or if you are a Workspace Admin or Moderator, you will also find the option for "public access". When you share with everyone, every workspace user will find the name of this saved radar view in their menu.
When you want to change the name of a saved radar view, its visibility, or delete it, navigate to the three dots next to the radar name [4]. You will find:
- edit view (adjust the name and the visibility settings)
- duplicate view (to create the same view, and maybe re-work it afterward)
- Export, and
- Delete
If you have applied a certain filtering, it will be saved along with the radar configuration.
Please note that a saving includes saving the radar configuration, e.g., the selected distance, color, or segment properties and your filters applied.
Auto-create Trend and Technology Radars
Find further instructions in this article.