DownloadTemplate
Fishbone Diagram Template
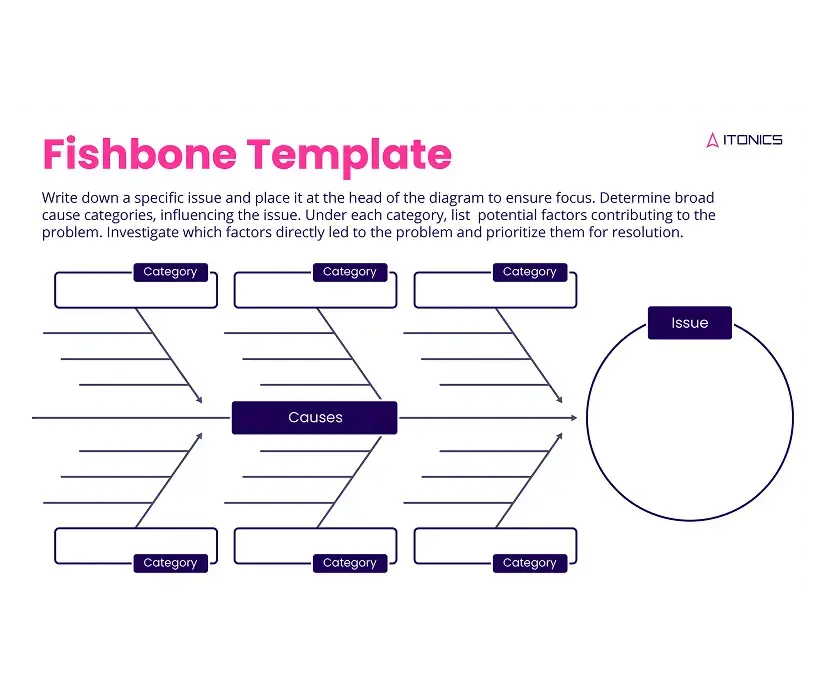
Free Fishbone Diagram Template (Ishikawa) to get to the bottom of complex problems
What's inside
Tired of surface-level solutions that don’t stick? The Fishbone Diagram (also known as the Ishikawa or Cause-and-Effect Diagram) is a tried-and-true method to analyze problems, identify root causes, and prevent recurring issues. Whether you're tackling process inefficiencies, quality concerns, or team bottlenecks, this template helps you and your team visualize every contributing factor in one clear view.
Download your editable Fishbone Diagram Template (available as PDF) and start solving problems with clarity and confidence. Perfect for workshops, retrospectives, and continuous improvement sessions.