Walk into any industrial manufacturer with 1,200 SKUs and ask which 200 generate 80% of revenue. They will tell you within an hour. Ask which of the remaining 1,000 should be retired, and you will hear silence.
What most companies do instead is run a Pareto analysis, cut the long tail, and declare victory. Two years later, the portfolio is back to 1,200 stock-keeping-units (short: SKUs), time to market is unchanged, and the supply chain still groans under variant proliferation. The complexity reduction program failed.
It failed because the model was wrong from the start.
This article gives you a different model. Five rules that contradict standard complexity management advice. Read them in order. They build on each other.
Why most product complexity reduction programs fail
The dominant advice in complexity management has three parts:
-
identify the long tail,
-
kill the underperformers, and
-
standardize what remains.
It sounds reasonable. It rarely works. But overall, there are three reasons it fails.
The long tail is where strategic value often hides. Custom-engineered variants for top 10 accounts frequently sit in the bottom 20% of revenue because they were sold once, at high margin, to anchor a major customer relationship. Cut them, and the account leaves quietly two years later.
"Underperforming" is measured against the wrong baseline. Most teams compare a variant's revenue to portfolio averages. The correct comparison is the variant's revenue against the cost of carrying it. A SKU generating $40K a year can still be wildly profitable if it costs $2K a year to maintain. The same SKU is a loss if it consumes $15K a year in engineering attention.
Standardization without architecture is theater. You consolidate three part numbers into one but keep the same number of suppliers, the same configurations, and the same engineering review cycles. SKU count drops in the report. Real complexity does not move.
The conclusion: SKU count is a vanity metric. Real complexity sits at the architecture, supplier, and configuration layers. Most reduction programs never touch those layers because they are harder to see and harder to change.
The two types of industry complexity industrial companies confuse
Every complex product portfolio contains two fundamentally different things mixed together (Exhibit 1). Treating them the same is why reduction programs damage the wrong parts of the business.
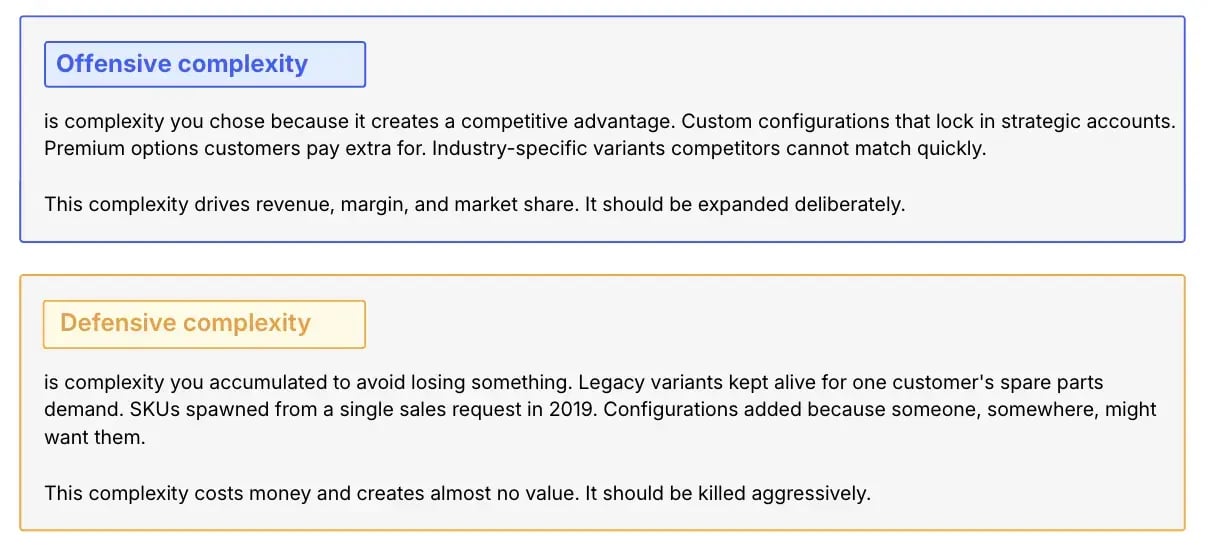
Exhibit 1: The two types of industry complexity
The strategic choice is not "how much complexity should we carry?" It is "which type are we accumulating?"
Most industrial companies accumulate defensive complexity faster than offensive complexity. They cannot tell the difference because their reporting treats every SKU the same way. Revenue per SKU and margin per SKU look similar in a dashboard. The strategic role of each variant looks identical when it is not tracked.
The diagnostic is straightforward. For every variant, ask two questions:
- Does the customer pay a premium for this variant specifically?
- Would losing this variant cause us to lose strategic accounts or competitive positioning?
If both answers are no, it is defensive complexity. If both are yes, it is offensive complexity. If one is yes, it is in the gray zone where most real strategic decisions happen. Run this audit across the portfolio and the picture changes fast.
A rulebook for managing product complexity
Aligning business strategy with product offerings and effective resource allocation is essential to achieve optimal product complexity management. Balancing a diverse range of product offerings with internal costs, while ensuring resources are allocated efficiently, helps organizations reach their strategic objectives and maintain competitiveness.
Five rules (Exhibit 2). Each one contradicts standard advice. Each one is usable next quarter.
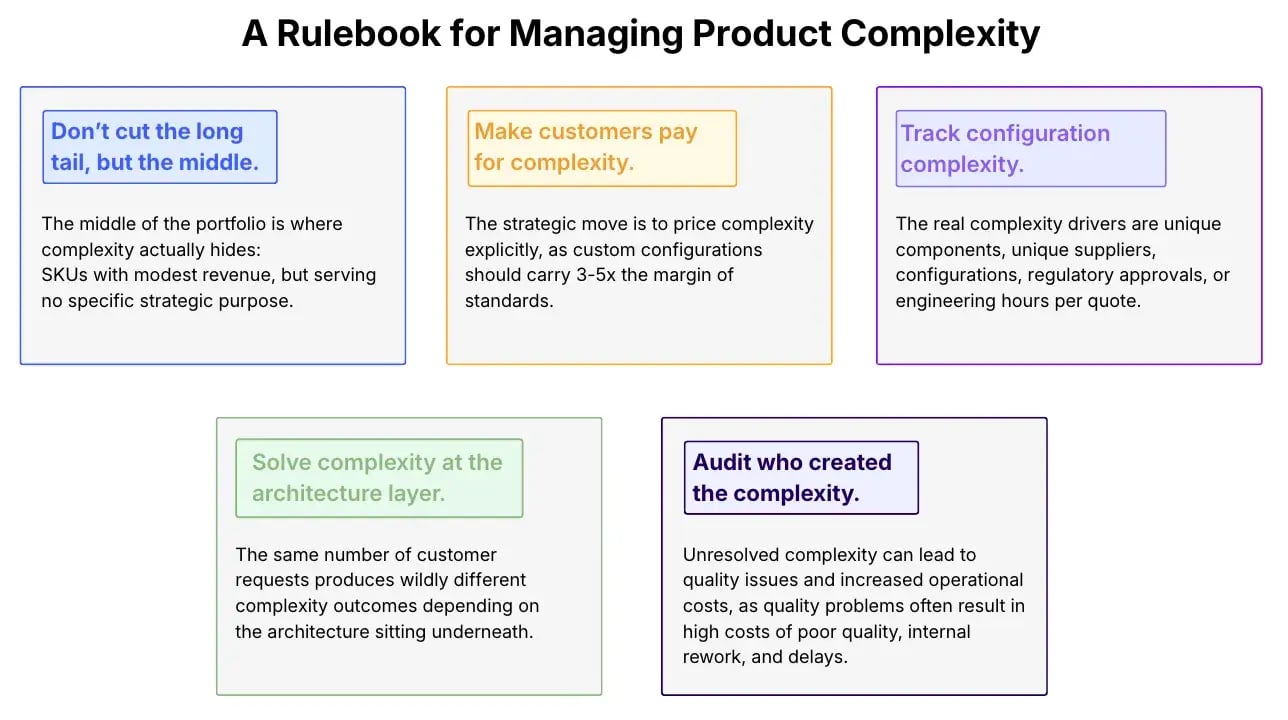
Exhibit 2: The five rules for managing product complexity
Rule #1: Don't cut the long tail. Cut the middle.
The long tail contains two very different kinds of SKUs:
-
pure waste (defensive complexity, low revenue, no strategic value) and
-
high-margin specialty work (offensive complexity, low revenue, anchor accounts).
Cutting indiscriminately destroys the second category along with the first.
The middle of the portfolio is where complexity actually hides: These are SKUs generating modest revenue, serving no specific strategic purpose, and competing with each other for sales attention. They look harmless because each one generates some money. They are not harmless. They absorb engineering bandwidth, supply chain capacity, and customer mindshare.
Rule #2: Make customers pay for the complexity they create
Most industrial manufacturers absorb the cost of custom requests. Sales agrees to a special configuration. Engineering builds it. Manufacturing supports it for 15 years. The customer pays a small premium that does not begin to cover the carrying cost.
When a customer hears the true price of custom work, most pivot to a standard variant. The ones who still want custom are signaling that the complexity is worth real money to them. They are worth supporting. Everyone else has just self-selected into your standard offering, which is what you wanted.
Rule #3: Track configuration complexity, not SKU count
SKU count is the wrong metric. A product line with 50 SKUs assembled from 3 base components is simpler than a product line with 10 SKUs assembled from 200 components.
The real complexity drivers are:
- Number of unique components across the portfolio
- Number of unique suppliers required
- Number of configurations the CPQ software has to validate
- Number of regulatory approvals needed per variant
- Number of engineering hours per quote
Thus, track these and the SKU count will follow. Most companies that obsess over SKU count end up consolidating part numbers while the underlying configuration complexity grows. The dashboard improves but the business does not.
Rule #4: Solve complexity at the architecture layer, not the product layer
By the time you have 1,200 SKUs to manage, the strategic choice has already been made. It was made five to ten years ago, when the product architecture was set.
-
If you have a monolithic architecture, every customer request creates a new variant.
-
If you have a modular platform architecture, every customer request becomes a configuration on a shared base.
The same number of customer requests produces wildly different complexity outcomes depending on the architecture sitting underneath.
For industrial manufacturers, the same logic applies. One pump platform with twenty market segment configurations beats twenty pump products with one configuration each. The first carries less internal complexity, ships faster, and meets customer expectations more flexibly. The second carries more complexity at every layer of the business.
Rule #5: Audit who created the complexity, not just what exists
Managing product complexity is a significant challenge for many organizations, with over 52% of product organizations citing complexity as a major hindrance, making accurate and consistent product data management a formidable task.
Complexity reduction programs typically ask: “Which SKUs should we kill?” The better question is: “Why did these SKUs get created in the first place?”
Most internal complexity has three sources:
- Sales adding variants for hypothetical customers who never materialized
- Engineering adding variants for technical elegance customers cannot perceive
- Marketing adding variants for segmentation that exists only in slide decks
If you do not fix the source, the tail grows back. Unresolved complexity can lead to quality issues and increased operational costs, as quality problems often result in high costs of poor quality, internal rework, and delays that hinder innovation and efficiency. You will run another complexity reduction program in three years and cut the same kinds of variants you cut this time. The cycle repeats because the incentive structure rewards adding, not subtracting.
Why the strategic choice is so hard to make
Even with the right rules, most industrial companies still fail to make the strategic choice. Three reasons.
#1 The cost of complexity is distributed across functions but the benefit accrues to one function.
Sales gets credit for the new variant that won the deal. Engineering carries the development cost. Supply chain carries the inventory cost. Finance carries the margin dilution. Support carries the documentation cost. No single function sees the total. The CEO theoretically sees it but rarely investigates at the SKU level.
#2 Killing a variant has visible political costs.
Keeping a variant has invisible economic costs. A product manager who proposes retiring a SKU gets pushback from sales, from engineering, and from the one customer who happens to still use it. A product manager who keeps every SKU gets no pushback at all. The system rewards inaction.
#3 The data needed to make the choice does not exist in one place.
Revenue is in ERP. Engineering cost is in PLM. Supply chain cost is in SCM. Strategic account context is in CRM. Pulling these together for 1,200 SKUs takes weeks. Most teams give up after the first attempt and revert to gut-feel decisions.
These three obstacles are exactly why this is a strategic choice. It requires explicit decision-making, executive sponsorship, and integrated data. None of these happen by default.
How ITONICS supports complex product portfolios in product development
Managing product complexity requires visibility across the existing portfolio (Exhibit 4), the innovation pipeline, and the strategic intent behind every variant. Most companies have this information scattered across PLM, ERP, CRM, and roadmap spreadsheets that nobody reconciles end to end.
/Still%20images/List%20Mockups%202025/portfolio-oversee-tasks-and-assignments-2025.webp?width=2160&height=1350&name=portfolio-oversee-tasks-and-assignments-2025.webp)
Exhibit 4: Keep every project and decision in view with dynamic views
ITONICS gives product teams that visibility in one place. By integrating tools for product data management and seamless communication, ITONICS improves efficiency and supports customer satisfaction, enabling teams to better meet customer demands and optimize operational performance.
The platform tracks every product, every variant, and every new product idea against strategic criteria (Exhibit 5). Teams score portfolio items by revenue contribution, strategic fit, lifecycle stage, and resource demand. The view connects existing products to incoming ideas, so the conversation about adding a variant happens alongside the conversation about retiring one.
/Still%20images/Reports%20Mockups%202025/portfolio-optimize-portfolio-returns-2025.webp?width=2160&height=1350&name=portfolio-optimize-portfolio-returns-2025.webp)
Exhibit 5: Enable data-driven steering and honest governance with live dashboards and reports
This is what makes the rulebook practical:
-
The middle of the portfolio (Rule 1) becomes visible because revenue and strategic value are tracked side by side.
-
Configuration complexity (Rule 3) becomes a portfolio-level dashboard rather than a manual audit.
-
The sources of complexity (Rule 5) become traceable because every variant has a documented origin and rationale.
The result is informed decisions about which complexity to keep, which to kill, and which to redesign at the architecture level before it ever reaches a SKU.
The strategic choice, stated clearly
Most industrial companies never make a strategic choice about product complexity. They let it accumulate, then occasionally cut indiscriminately, then watch it accumulate again.
The companies that win make three explicit decisions:
- We accumulate offensive complexity deliberately. We kill defensive complexity aggressively.
- We measure real complexity (configurations, components, suppliers, quoting time), not vanity metrics (SKU count).
- We solve complexity at the architecture layer, not the variant layer.
These decisions sound simple. They contradict most of the complexity management advice in circulation. Which is exactly why most companies never make them.
The strategic choice is yours. The default is more complexity, slower time to market, longer sales cycles, and weaker margins. Make the choice deliberately, or the choice will be made for you by every customer request, every sales exception, and every engineering compromise that goes unchallenged.