Skip to content
Featured image: Product Portfolio Management for Engineering: Beyond Spreadsheets
Product Development

Product Portfolio Management for Engineering: Beyond Spreadsheets

Engineering organizations run a different beast from typical project portfolios. Hardware-software interlock, specialized capacity, 18 to 36 month development cycles, supplier dependencies. Most product portfolio management advice treats engineering programs like generic projects. It does not work.

Engineering leaders at large companies run 15 to 40 simultaneous programs. Each one has its own Jira board, Smartsheet file, and weekly status meeting. Yet most CTOs cannot answer one question on demand: which programs are on track to deliver business goals this quarter, and which are quietly failing.

The cause is rarely poor task management. It is the gap between project execution and portfolio decisions, made worse by frameworks that ignore what makes engineering organizations different.

This article explains why product portfolio management breaks in engineering organizations specifically. It lays out the framework R&D leaders use instead. And it shows how Toyota and Lear closed the gap without rebuilding their toolchains.

Why product portfolio management breaks in engineering organizations

Product portfolio management is the discipline of running multiple linked projects toward a coherent set of business goals. A vehicle platform with 12 variants. A drug pipeline across discovery and clinical stages. A semiconductor node powering 30 chip designs.

At enterprise level, a single program touches 4 to 12 functions. R&D, supply chain, manufacturing, regulatory, finance, sales. Each function uses its own project management tools. Each maintains its own version of the truth.

None of the breaks below are task management problems. Adding a Gantt chart or time tracking tool does not fix them. They are governance problems specific to how engineering organizations operate at scale.

Decision latency stretches to weeks

A program manager needs to reroute 30 engineers from one project to another. Making the call requires cost data from finance, capacity data from resource management, and dependency data from each project team. Pulling this together takes 2 to 3 weeks. By then the window to act has closed.

The result is a portfolio managed by snapshots that are always stale. Decisions apply to a state of the world that no longer exists.

Status conflicts across project management tools

The PMO dashboard shows green. The engineering lead says amber. The supplier says red. Each pulled status from different management tools at different times.

No single source of truth exists. Status meetings become verbal reconciliation sessions. The slide deck produced becomes the working truth until next week overwrites it.

Strategic drift in long programs

Programs launched 18 months ago tied to priorities that no longer apply. Nobody re-evaluates them. Project managers keep delivering tasks that no longer serve business goals.

In long-cycle engineering work, this is the most expensive failure mode. A program can run for years tied to a strategy that quietly shifted underneath it.

What makes engineering organizations different from generic portfolios

Most product portfolio management frameworks assume software-style projects: 6 to 12 month cycles, interchangeable developers, minimal physical dependencies, but engineering organizations break every assumption.

Hardware, software, and firmware ship on different cycles

A SaaS portfolio ships features independently. An engineering portfolio ships hardware once every 18 to 36 months, with firmware and software dependencies locked in 12 to 24 months before launch.

A decision to delay sensor sourcing in March affects firmware scope in June and customer-facing software in September. Generic project management tools cannot model this. Engineering teams need cross-stack dependency visibility.

Specialized capacity and supplier dependencies cross programs

Generic PPM assumes capacity is interchangeable FTEs. Engineering organizations run on specialized roles: senior systems engineer, RF design engineer, embedded firmware lead, regulatory affairs specialist. You cannot reassign a power electronics expert to fill a gap in safety certification.

Engineering portfolios also share critical components, single-source suppliers, IP, and test infrastructure. A sourcing decision in one program cascades to others. Without portfolio-level visibility, supply risk concentrates without anyone seeing it.

Technical stage gates and platform-variant logic

Engineering organizations use TRL (Technology Readiness Level), MRL (Manufacturing Readiness Level), and design gates. A program reaches stage 4 when the prototype passes specific tests, not when 6 months have elapsed. Gates are evidence-based, not calendar-based.

Engineering organizations also rarely run flat lists of programs. They run one platform program supporting 5 to 15 variant programs. Generic PPM models programs as siblings. Engineering organizations need platform-variant graphs where a decision on the platform cascades to every variant.

These structural differences are why generic product portfolio management methods underperform in engineering organizations. The framework has to be designed for engineering, not retrofitted.

Three failure patterns project management tools cannot fix

Specific patterns recur across engineering organizations. Each stems from missing portfolio governance, not from missing task management features.

#1: The capacity illusion

Each project manager reports their team at 90% capacity. Add them up across projects, and the organization is at 200% or more. Nobody has a real-time view of who is actually committed where, or what specialized skills are oversubscribed.

A single senior systems engineer can quietly be committed to 5 programs at 40% each. The total reaches 200% before anyone notices. Resource management lives in PowerPoint. Project management software shows tasks, not real cross-project resource conflicts.

#2: The status meeting tax

Senior program managers spend large portions of their week in cross-functional status meetings. Most of the meeting is verbal reconciliation of conflicting data from different management tools. The meeting produces a slide deck. The slide deck becomes the source of truth until next week's meeting overwrites it.

This is not team collaboration. It is human ETL. Real-time collaboration on shared portfolio data eliminates the majority of these meetings.

#3: The disconnected portfolio review

Quarterly portfolio reviews happen 8 to 12 weeks after the data is current. Decisions made apply to a snapshot that no longer exists. Programs continue. Strategic priorities shift. The next review re-discovers the gap.

In long-cycle engineering work, the lag between portfolio decision and execution change can stretch to months. Programs that should have been killed continue burning resources. Programs that should have been accelerated wait for the next review cycle.

None of these are fixed by adding custom fields, new project templates, or another timeline view. They require a different category of management tools.

The product portfolio management framework for engineering organizations 

Engineering organizations need a portfolio infrastructure that sits above project management tools and accounts for their structural differences. It connects strategy to engineering execution. It gives real-time visibility across multiple projects in one place.

Seven principles of engineering portfolio governance 

These seven principles separate product portfolio management from task management (Exhibit 1). Most engineering organizations have invested heavily in task management tools and skipped the portfolio layer.

Seven principles of engineering governance

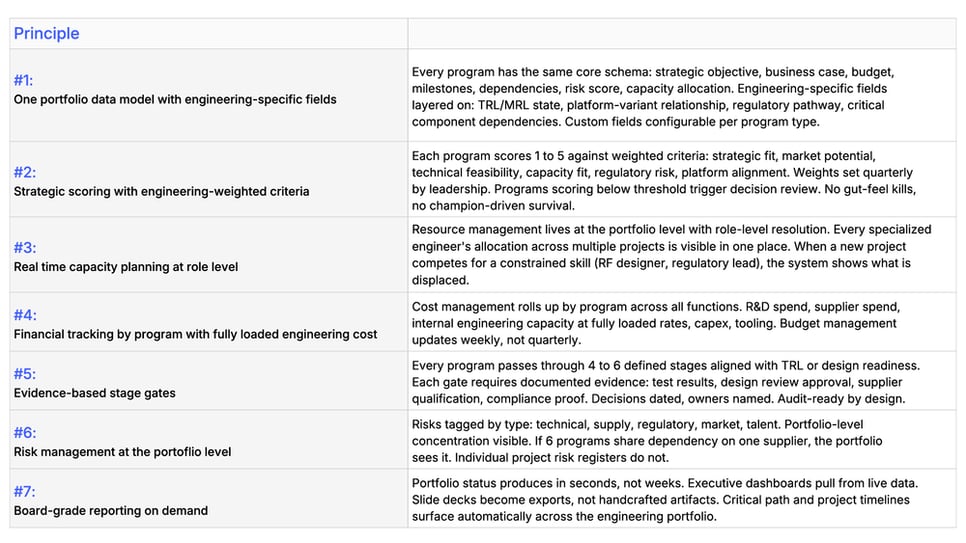
Exhibit 1: Seven principles of engineering governance

Why the Gantt chart is not the answer 

A Gantt chart works inside a single project. It visualizes task sequence and dependencies. At the portfolio level across multiple projects, the Gantt views break down.

What works instead: portfolio roadmap views (Exhibit 2), milestone-level swim lanes, capacity heatmaps, platform-variant maps.

Oversee growth strategy, R&D planning, project governance, and transformation initiatives in portfolio views

Exhibit 2: Oversee growth strategy, R&D planning, project governance, and transformation initiatives in portfolio views

These tools offer compressed visibility across multiple projects. Task-level detail stays inside individual project management software.

Whereas the interaction model is layered. Portfolio tools handle program-level governance. Project management tools handle task-level execution. Integration between layers is automated. Manual reconciliation drops close to zero.

From task management to financial tracking: the management tools gap

Most engineering toolchains are strong on task management and weak on financial tracking by program.

Task tracking lives in Jira or Smartsheet. Financial tracking lives in SAP or Oracle. Capacity planning lives in Excel. Portfolio status lives in PowerPoint. These tools rarely talk to each other.

The result 

Program managers in engineering organizations cannot answer four basic questions in real time.

  1. What did this project cost this month, including fully loaded engineering capacity?
  2. What is the forecast burn to the next technical milestone?
  3. Which other projects depend on this team's deliverables or shared components?
  4. What is the strategic rationale for continuing versus killing this program?

Each question requires pulling data from a different tool. Manual aggregation eats program manager hours that should go to decisions.

Tip

Closing this gap needs a portfolio platform that integrates with existing project management software, not replaces it.

The portfolio layer ingests project data, capacity data, and financial data. It standardizes the model and exposes program-level views to executives.

This integration model is how leading engineering organizations manage projects across portfolios without drowning program managers in reconciliation work.

Best practices for cost management across engineering projects

Cost management across projects is where most engineering programs fail first. The dollars are visible. The decisions about them are not. Five best practices cut the structural waste.

#1: Burn rate visibility at weekly cadence

Forget monthly close. Pull labor, supplier, and capex commitments weekly. Forecast burn to next milestone. Compare against the budget management baseline. Variance over a set threshold triggers escalation within 48 hours.

#2: Internal capacity costing, not just external spend

Most R&D cost management tracks only external supplier spend. Internal engineering capacity is invisible. Apply fully loaded rates per role. Capacity allocation becomes a cost line, not a free resource.

#3: Program-level P&L view

Roll up all costs by program across departments. A semiconductor program might span chip design, software, validation, and packaging. Each function reports separately. Without program-level rollup, the true cost stays hidden.

#4: Stage-gate budget release

Do not release the full program budget upfront. Release 20 to 30% at each stage gate. Continued release requires evidence: technical milestones hit, market signals confirmed, capacity available. This caps the cost of programs that should have been killed earlier.

#5: Cross-program reallocation rules

Define rules for when the budget moves between programs. Acceleration of one program comes from explicit decisions to slow or kill lower-priority work. No silent reshuffling. Every reallocation is logged, dated, and tied to a documented strategic decision.

The common factor: financial tracking treated as portfolio infrastructure, not as a project reporting task.

How leading engineering organizations manage projects across portfolios

Two ITONICS customers show how engineering organizations apply portfolio governance in practice.

Toyota Motor Europe: 200 projects across European manufacturing centers

Toyota Motor Europe's production engineering innovation teams were tasked with streamlining all manufacturing centers in the European region to maximize research and innovation efficiency. The existing setup spread information across scattered sources and disparate teams.

Before choosing a platform, the team evaluated 40 innovation software systems against requirements for a top-level system. ITONICS met the requirements and was selected.

Today, the platform runs with 500+ active Toyota members across European manufacturing centers.

  • 200 projects of varying sizes sit on the platform with a clear pipeline of new opportunities and proposals.

  • 500 external companies are registered.

  • 58 external events have been run through the platform with several hundred virtual contributors evaluating new companies, proposals, and projects.

The shift is structural, as Andrew Willett, Senior Expert at Toyota Motor Europe, framed it directly.

Targeted innovation requires a single point of truth, a single source of innovation to guide people and to make it easy for them to find what's going on in our organization.

Three Governance Outcomes anchoring the result
  1. Process optimization connects early-stage market research efforts with actual realized projects and final impacts.
  2. Controlled access maintains confidentiality through multiple user and rights concepts across interim staff, such as interns or contractors.
  3. Collaborative ratings produce uniform evaluations of companies and projects, replacing scattered subjective calls.

Lear Corporation: AI-powered technology portfolio management

Lear Corporation is a global automotive technology leader in Seating and E-Systems with approximately 165,000 employees across 39 countries. Lear Innovation Ventures (LIV), based in Southfield, Michigan, advances mobility innovation for the company.

The challenge: scan emerging technologies, evaluate them with the right experts, and turn the result into technology portfolios that drive CTO-level decisions. Without infrastructure, signal noise drowns out actual insight. With infrastructure, the same input becomes a portfolio.

Lear built a three-tiered approach on the ITONICS platform: scouting, evaluation, and processing.

Lear's approach

Scouting uses the Insights module and Radar views to continuously monitor news, academic research, and patents. AI-powered algorithms scan high volumes of time-series input to identify gaps and blind spots that global engineering experts can act on.

Evaluation moves from sensing to judgment. LIV Core Team domain experts and Strategy analysts collaboratively rate AI-assisted discoveries. The most relevant technologies move to deeper assessment. Insights module queries investigate them further.

Processing creates the actual technology portfolios. The output goes to the CTO with strategic recommendations: invest in internal know-how, partner with startups, expand business unit collaboration. Bi-annual reports update each business unit and stakeholder.

The numbers reflect the scale. 1 million weak signals scanned. 118 trends evaluated. 12 key trends identified for portfolio-level action. John Absmeier, CTO at Lear Corporation, explained the purpose: "We aimed to enhance strategic alignment across business units and preemptively develop rigorous capabilities, products, processes, and technologies to continuously future-proof our business."

Outcome

Both Toyota and Lear share the pattern. Project management tools handled their tasks. The change came from adding a portfolio governance layer above them. Engineering organizations get visibility across multiple projects without forcing every team onto one tool.

Implementation: rolling out product portfolio management beyond spreadsheets

Moving from spreadsheets to portfolio infrastructure is not a software migration. It is a governance change. The software is the easy part. Treat it that way, and the rollout works.

A 90-day implementation plan works in two phases.

Phase 1: Set up the portfolio model and governance flow within the first 45 days

List every active program. For each, record strategic objective, budget, headcount, current stage, next milestone, and owner. Stop at 80% complete. Do not chase perfection.

Define the standard data schema: 12 to 18 portfolio fields including 4 to 6 custom fields per program type. Add engineering-specific fields: TRL state, platform-variant link, critical component list, regulatory pathway. This becomes the template for every new project going forward.

Define stage gates, typically 4 to 6 stages from concept to launch, aligned with engineering readiness levels. Define decision rules at each gate. Name decision owners and reviewers. Document the evidence each gate requires.

Build the scoring model: 4 to 8 strategic criteria, weighted by leadership, scored quarterly. Start simple. Refine after the first cycle.

Phase 2: Pilot rollout and integration in the following 45 days

Pick one division with a contained portfolio of 10 to 20 programs. Migrate their data into the portfolio platform. Run the first stage gate using the new flow. Capture friction points.

Do not roll out to the entire organization yet. Single-division rollout produces evidence and credibility. Enterprise-wide rollout without proof generates resistance.

Connect to existing project management tools via API. Project teams keep their preferred task tracking. Portfolio data updates automatically from project data. Manual reconciliation drops out.

Connect to financial systems. Capacity data flows in from HR or resource management modules. Real time updates replace weekly Excel exports.

After day 90, scale in 60-day waves. After each wave, refine the model based on what worked. By month 9 to 12, the full engineering organization runs on the portfolio platform.

Avoid two common mistakes.

  1. Do not try to replace existing project management software. The portfolio layer sits above it.

  2. Do not pilot with small teams that lack the portfolio governance problem. Start where the pain is.

How ITONICS enables product portfolio management for engineering organizations

ITONICS is built as a portfolio governance infrastructure for innovation, R&D, and engineering organizations. It is the system of record above the project management tools that engineering teams already use. Toyota Motor Europe and Lear Corporation are two examples among many.

Five capabilities directly address product portfolio management for engineering organizations at the enterprise level.

Configurable portfolio data model. Standard fields for strategic objective, budget, milestones, capacity, and risk. Engineering-specific custom fields for TRL/MRL state, platform-variant links, and component dependencies. No-code configuration by customer admins. No vendor tickets to add a field or change a workflow.

Real-time portfolio visibility. Live dashboards across multiple projects (Exhibit 3).

Time-to-market, wait states, and pipeline health generated from live data

Exhibit 3: Time-to-market, wait states, and pipeline health generated from live data

Capacity heatmaps with role-level resolution, financial tracking by program, dependency views across the engineering stack, strategic scoring through interactive radars, and roadmaps. Board-grade reports are generated in seconds, not weeks.

Evidence-based stage-gate flow. Defined stages, configurable per program type. Decision logs dated, owners named, and technical evidence attached. Audit-ready by design, which matters when regulators or internal auditors ask.

Integration with existing project management software. Connectors to Jira, Azure DevOps, MS Project, ServiceNow, and other tools. Project teams keep what they prefer. Portfolio data flows up automatically. Third-party integrations cover financial systems and resource management modules.

Federated rollout by entity, BU, or region. Configurable workspaces per division. Each entity uses the platform with its own UX while leadership sees one consolidated portfolio view. Toyota runs this model across European manufacturing centers. Lear runs it across global engineering and business units.

ITONICS does not replace your project management tools. It connects them into one portfolio view. The result: product portfolio management that scales beyond spreadsheets, status meetings, and quarterly PowerPoint decks.

Engineering leaders in automotive, pharma, defense, ICT, and industrial sectors use ITONICS to run programs as governed infrastructure. For long-term engineering portfolios, ITONICS is the system of record.

FAQs on product portfolio management for engineering organizations

How is product portfolio management for engineering organizations different from generic PPM?

Generic PPM assumes interchangeable resources, software-style cycles, and minimal physical dependencies. Engineering portfolios have specialized capacity constraints (a senior RF engineer cannot be swapped for a generic developer), 18- to 36-month cycles, shared components across programs, and evidence-based technical stage gates.

Engineering portfolio governance has to account for these. Generic PPM tools usually do not.

Do we have to replace our current project management tools?

No. Portfolio management tools sit above project management software. Project teams keep using Jira, Smartsheet, MS Project, or whichever tool they prefer. The portfolio layer ingests data from these tools via API.

Integration takes 4 to 8 weeks for typical enterprise toolchains. Replacement is neither required nor recommended. Toyota Motor Europe kept its regional project management tools and added the portfolio layer above them.


How is this different from PPM tools like Planview or Clarity?

Traditional PPM platforms focus on task tracking, time tracking, and resource scheduling at scale. They are project management software with portfolio reporting bolted on.

Strategic portfolio platforms focus on strategy-to-execution linkage, innovation portfolio governance, and stage-gated decisions. PPM tools answer "how is the work going?"

Strategic product portfolio management tools answer "should we be doing this work?"

Can small teams use this approach, or only large engineering organizations?

Portfolio governance pays off when you manage 8 or more simultaneous programs. Below that threshold, a simple project management tool with custom fields is enough. Enterprise users typically run 25 to 200 programs. For teams under 10 programs, free plan options on tools like Asana or Trello may be sufficient.

The break point is roughly the number of programs no single human can hold in their head.


How long until we see ROI from product portfolio management?

First cost savings show up within months: killed zombie programs and recovered capacity. Decision cycle compression is visible early. Full ROI in cost management typically shows once the portfolio governance flow has run through at least one stage-gate cycle for every program.

The biggest single source of savings: killing projects that should have been killed 12 to 18 months earlier.

How do we manage adoption when project managers resist?

Adoption fails when portfolio tools threaten existing project management workflows. Adoption succeeds when project teams keep their tools, and only program managers and executives use the portfolio layer. Tie the executive reporting to the new system. When the board reviews come from live data, manual decks become extra work. Adoption follows.