Skip to content
Featured image: How to Track and Report R&D KPIs Using ITONICS
R&D and Tech

How to Track and Report R&D KPIs Using ITONICS

Most R&D scorecards measure activity. R&D spend, headcount, new ideas submitted, projects approved. None of these predicts whether R&D efforts will move the business.

The result is predictable. R&D leaders defend budgets with metrics that boards do not trust. Teams celebrate idea volume while the innovation pipeline stalls before market release. Strategy teams cannot tell which projects deserve more resources.

Better R&D KPIs answer one question: do our R&D activities produce the desired outcomes the business strategy requires?

This article covers which key performance indicators (short: KPIs) to track, where most teams go wrong when measuring R&D performance, and how to set up reporting that drives decisions instead of decorating slides.

What R&D KPIs actually measure

R&D KPIs are quantitative measures that track how research and development activities perform against strategic objectives. They fall into two categories: input metrics and output metrics.

Knowledge

Input metrics describe what you put into the research process. R&D spend as a percentage of revenue. Headcount in innovation teams. Number of patents filed. Ideas generated in a specified period.

Output metrics describe what you get out. Revenue generated by products launched in the last three years. Cost savings achieved from process improvements. Time to market. Customer satisfaction with new releases.

Most R&D leaders over-index on input metrics because they are easy to collect. The problem is that input metrics rarely predict R&D outcomes. Two companies can spend the same amount on R&D and produce wildly different results. The question is what each dollar buys.

Strong measurement uses both. Track only inputs, and you reward effort. Track only outputs, and you cannot diagnose problems early enough to fix them.

Input metrics vs. output metrics: where teams go wrong

The most common failure in measuring R&D performance is picking vanity metrics because they look good in slides.

"Ideas generated this quarter: 412." A meaningless number unless you also track how many entered evaluations, how many got funded, and how many produced revenue.

"R&D spend: $48M." A budget line, not one of the performance metrics that matter. It tells you nothing about research efficiency or whether the spend is moving the business.

"Projects completed: 27." If completion is the goal, teams will close projects regardless of whether they hit business objectives. Counting projects completed without measuring strategic value rewards activity, not impact.

To accurately measure R&D, pair every input metric with an output metric that closes the loop (Exhibit 1).

Pairing Input Metric with Output Metric

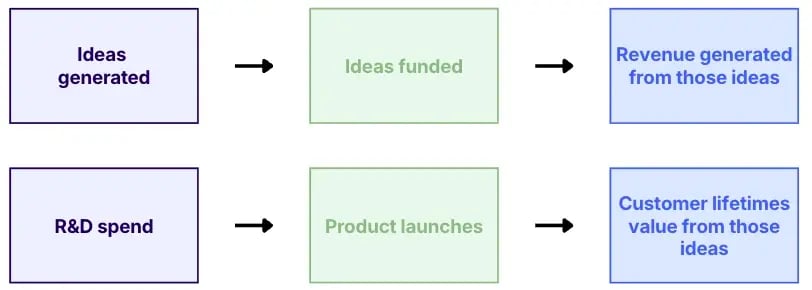
Exhibit 1: The pairing of input and output metrics

Without this pairing, you cannot identify areas where the R&D process is breaking down.

The 8 R&D KPIs that connect R&D activities to business objectives

These eight KPIs cover the chain from idea to financial impact. Pick the subset that matches your business strategy. Tracking all eight rarely works because teams ignore metrics that do not tie to their work.

#1: Idea generation rate

New ideas submitted per employee per specified period, weighted by relevance to strategic goals. Raw volume is a vanity metric. Volume weighted by strategic fit tells you whether innovation groups understand where the business is heading.

How to use it: set a target idea generation rate per strategic theme. If 80% of ideas land in one theme, your funnel is biased and missing strategic priorities.

#2: R&D pipeline conversion

Percentage of ideas that move from each stage to the next. Track stage-to-stage conversion, not just overall throughput. A pipeline that converts 40% at ideation but 4% at piloting has a piloting problem, not an ideation problem.

How to use it: review conversion ratios on innovation initiatives quarterly. Investigate any stage with a sudden drop. Stage drops usually point to resource bottlenecks or unclear evaluation criteria in the product development process. Highlight the innovative initiatives that convert above benchmark and the patterns become repeatable.

#3: Time to market

Days from approved concept to first market release. This is the single most predictive R&D KPI for competitive advantage in fast-moving categories. Shorter cycles let you respond to customer feedback and market trends with less guesswork, and they let you outpace the competitive landscape.

How to use it: measure by project type. Process improvements may take 90 days. New product platforms may take 18 months. Track each category against its own benchmark, not a company-wide average.

#4: Cost savings from process improvements

Annualized cost savings achieved from R&D-driven process changes. This is one of the cleanest financial metrics for justifying R&D budgets to finance. It also makes process innovation visible, which most innovation infrastructure ignores.

How to use it: track cost savings per project against the total cost of the work. Compare against R&D investment in process improvements. A 3:1 return on process work is realistic in industrial companies.

#5: Revenue from new products

Percentage of the company's revenue generated by products launched in a specified period, typically the last 3-5 years. This is the headline output metric for product innovation. 3M historically targeted 30% from products under five years old. The right number depends on your product life cycles.

How to use it: pair with margin data and customer lifetime value. Revenue growth from new products at low margins is not innovation success. It is a price war.

#6: Project success rate

Percentage of successful projects against total projects completed. Define "successful" upfront: hit business objectives, delivered to scope, and generated planned monetary value. Without a definition, the success rate becomes whatever leadership wants it to be.

How to use it: track success rate by project type and risk class to measure performance at the right level. High-risk projects should have lower success rates. If your incremental work fails at the same rate as your moonshots, your portfolio is not actually balanced, and team performance signals are misleading. The point is to measure success, not to inflate it.

#7: Resource utilization

Percentage of R&D capacity allocated to projects aligned with strategic priorities. Low utilization signals waste. Misaligned utilization signals worse: full pipeline, wrong projects. Optimized resource utilization means the right people on the right work, not just billable hours.

How to use it: combine with portfolio health data. If 60% of R&D capacity is in maintenance work but strategic plans call for transformation, your resource allocation contradicts your strategy.

#8: Customer-validated outcomes

Percentage of launched projects that meet pre-defined customer needs and adoption targets. This is what separates real innovation success from technically completed projects. A project that ships but no target customers adopt is a measurable failure, not a partial win.

How to use it: define adoption and customer satisfaction targets before launch. Track against actual customer behavior 6 and 12 months after market release. Add product quality data from support tickets and returns to round out the picture.

How R&D metrics connect to financial metrics

R&D metrics that do not tie to financial metrics get cut in the first budget review. The connection has to be explicit, not assumed.

Map each R&D KPI to a financial line (Exhibit 2):

Mapping R&D KPIs to a Financial Line

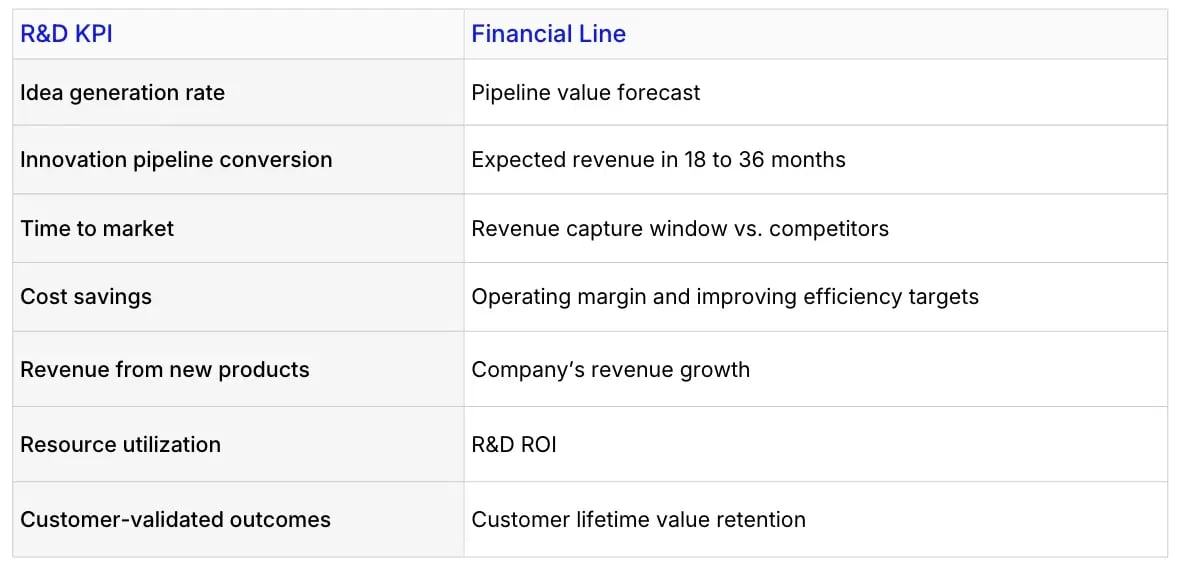
Exhibit 2: Mapping KPIs to a financial line

Without these links, finance treats R&D as overhead. With them, R&D becomes a measurable driver of financial health.

The practical test: can you trace any innovation KPI to a number in the P&L within three steps? If not, that metric will not survive a downturn. Keep only the relevant metrics that pass this test.

Aligning R&D KPIs with business strategy

The same R&D KPIs can support very different business strategies. The targets and weights you set determine what behavior you reward.

  • A cost-leadership strategy weighs cost savings and resource utilization. The innovation pipeline should be heavy on process improvements, not new platforms.

  • A differentiation strategy weighs revenue from new products, time to market, and customer-validated outcomes. Cost savings still matter, but they do not define innovation success.

  • A diversification strategy weighs idea generation rate across new categories, pipeline conversion in unfamiliar markets, and project success rate on high-risk initiatives.

Tip

Pick three to five R&D KPIs that match your strategic objectives. Innovation leaders who track ten KPIs end up with teams that focus on whichever metric affects their bonus and ignore the rest.

Common reporting traps that hide R&D performance

Three patterns make R&D reporting look healthy while masking real problems (Exhibit 3).

Three Patterns making R&D reporting look healthy

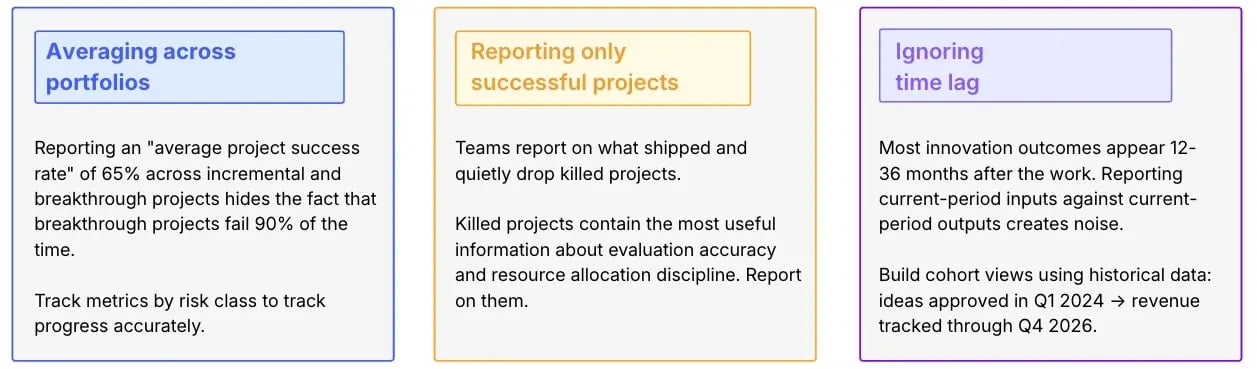
Exhibit 3: The three patterns making R&D reporting look healthy

The discipline is not adding more metrics. It is reading the ones you have correctly.

Tracking R&D KPIs and innovation pipeline health in ITONICS

Spreadsheets and standalone tools work until you go beyond five KPIs across two business units. Then data quality breaks down, numbers do not reconcile, and reporting takes longer than the actual work.

ITONICS centralizes R&D KPI tracking across all innovation activities in one platform:

  • ITONICS Lists show every project with its current KPI values (Exhibit 4). Set thresholds on any field, and the system flags projects that breach targets without manual review.


Exhibit 4: Customize tables with columns and attributes you need to sort by any criteria and filter

  • ITONICS Roadmap ties projects to time-to-market commitments and surfaces dependencies (Exhibit 5). When one project slips, you see which downstream initiatives are at risk.

Projects, owners and dependencies shown on one roadmap | ITONICS
Exhibit 5: See how teams, priorities, and tasks align to hit critical milestones on shareable, uncluttered timelines

  • Portfolio matrix views plot projects across two KPIs at a time (for example, strategic value vs resource utilization), making portfolio imbalances visible at a glance.
  • Kanban boards track stage conversion in real time, so pipeline drop-offs become visible the day they happen, not at quarter-end.
  • Automated reporting pulls KPI data into board-ready exports. This removes the manual reporting work that consumes 20-30% of innovation team capacity in spreadsheet-based setups.

The result is a single source of truth for R&D KPIs. Finance, strategy, and innovation teams work from the same numbers. Decisions get made faster because no one is reconciling versions of the same dashboard.

FAQs on tracking and reporting R&D KPIs

How many R&D KPIs should we track?

Three to five active KPIs per team. More than that, people ignore the metrics that do not tie to their work. A central dashboard can hold 10-12 total, but each team should see only what they directly influence.

What is a realistic time to market benchmark?

It depends on project type and industry. Process improvements: 60-120 days. Incremental product updates: 6-12 months. New platforms: 18-36 months. Set your own benchmark from historical data, then aim to cut it by 20% per cycle.

How do we measure innovation performance for early-stage ideas with no revenue yet?

Use leading indicators: customer interview completion rates, signed letters of intent, pilot conversion to paid engagements, and time-to-decision at each stage gate. These predict measurable outcomes 12-18 months before revenue appears.

Should we tie R&D bonuses to KPIs?

Partially. Tie bonuses to output metrics that teams can directly influence (project success rate, time to market, cost savings achieved). Avoid tying bonuses to idea generation rate or pipeline conversion, which incentivizes gaming the system.

How often should we report on R&D KPIs?

Operational metrics (pipeline conversion, time to market): monthly.

Strategic metrics (revenue from new products, resource utilization vs strategy): quarterly.

Annual reviews should focus on cohort analysis, not point-in-time snapshots.

What is the fastest way to improve R&D reporting quality?

Define each metric in writing: what counts, what does not, who owns it, and how often it is updated.

Most reporting problems come from definitional drift, not data quality. Spend a week on definitions before adding any new dashboard.