The pattern is consistent. Product development teams spend 18 to 36 months in development. Sales teams prepare positioning and messaging. Marketing efforts ramp up. Launch day arrives. The initial launch underwhelms. Six months later, the post-launch reviews blame execution.
The diagnosis is wrong. The product launch plan was built against signals that had already shifted. Sales reps faced a target market that had moved. Existing customers had quietly started solving the problem differently. The launch metrics that mattered were already drifting in CRM data and customer feedback channels months before launch day.
This article gives product development teams a six-signal framework, a new product launch checklist, and the success metrics that actually predict product launch success.
The thesis is simple: stop treating launch execution as the failure point in industrial product launches. Treat it as the symptom.
Why industrial product launches fail before launch day
The conventional view holds that product launches fail at the launch. Bad positioning and messaging. Weak sales enablement. Underfunded paid ads. A marketing campaign that misses the target audience.
That view explains roughly 15% of cases. The other 85% of industrial product launches fail because the portfolio decision was made against a market state that no longer existed by launch day.
Three failure patterns repeat across industrial product launches:
None of these are launch execution problems. They are signal interpretation problems baked into the product launch plan before launch day.
The six-month window most launch plans ignore
Most product launch plans for industrial product launches treat the period from design freeze to launch date as pure execution. Build, test, market, ship. Run paid ads. Send sales reps into sales conversations.
That treats market research and customer feedback as inputs to the initial design, not the ongoing launch plan. It is the most expensive assumption in industrial product launches.
Real signal timing:
- Patent filings appear 12 to 18 months before competitor product launches
- Regulatory drafts circulate 12 to 24 months before binding rules
- Customer pain drift shows up in support ticket categories 6 to 9 months before purchase behavior changes
- Pipeline conversion rates on the target market move 3 to 6 months before deals stop closing
- Distributor margin pressure precedes channel consolidation by 9 to 12 months
- Published research density on substitute technologies shifts 12 to 18 months before commercial alternatives ship
The product team already has access to every one of these. Cross-functional teams across product, sales, market intelligence, and IP track them. The information sits in different systems and never reaches the launch plan.
The fix is not more data. It is a coordinated effort that routes signal data to launch decisions on a fixed cadence. Most teams running a successful product launch strategy review six signal categories every two weeks during the six months before the launch date.
Six portfolio signals that predict launch execution problems
This is the rulebook for industrial product launches. Each signal has a detection method, a threshold, and a launch plan implication. Together they form the operating model behind every successful product launch in industrial categories.
/Still%20images/Reports%20Mockups%202025/portfolio-optimize-portfolio-returns-2025.webp?width=2160&height=1350&name=portfolio-optimize-portfolio-returns-2025.webp)
Exhibit 1: Track signals and developments in real-time with ITONICS' dashboards and reports
Track all six on a single dashboard owned by the product team.
#1: Customer pain drift
What it is: The urgent pain your product solves has been partially addressed by adjacent tools, workflow changes, or substitutes.
#2: Competitive convergence
What it is: A competitor is positioning to ship similar features, bundles, or messaging into the same target market.
#3: Technology substrate shift
What it is: The underlying technology your product depends on is being leapfrogged or commoditized.
#4: Regulatory or compliance pivot
What it is: New rules change the buying criteria or required certifications for industrial product launches.
#5: Channel and distribution assets
What it is: Your route to market is consolidating, losing margin, or shifting buying behavior away from your existing channels.
#6: Pipeline early warning
What it is: Conversion rates on the target customer ICP are slipping in pipeline data before launch.
What market research at the portfolio stage actually requires
Most industrial product launches do market research twice: Once during portfolio approval. Once for launch messaging. The middle 18 months of product development get no fresh research. That is where most launches go wrong.
What good market research looks like across the product lifecycle:
- Quarterly customer interviews with 8 to 12 ideal customers. Same questions. Track language shifts over time.
- Monthly win/loss reviews on a rolling 90-day window of closed deals. Sales reps tag reasons in CRM. Product marketing reviews patterns.
- Continuous monitoring of three competitor signals: pricing changes, feature shipments, and hiring patterns.
- Bi-weekly review of support ticket categories from existing customers.
This is market research as an instrument panel, the product team checks the way pilots check altitude.
The cost: one product team member, 4 to 6 hours per week.
The output: a single-page signal dashboard updated every two weeks.
This dashboard becomes input to launch plan decisions, not a slide for a quarterly review. It triggers actions on defined thresholds, which is why the product launch strategy is important to the launch's outcome must be operational, not ceremonial.
Success metrics that act as leading indicators of launch failure
Most product launch teams measure success after launch. Active users, revenue growth, customer acquisition cost, and market share movement.
These are lagging launch metrics. They tell you whether the launch succeeded 90 to 180 days after launch day. By then, the budget is spent.
Leading success metrics product teams should track in the six months before launch (Exhibit 2):
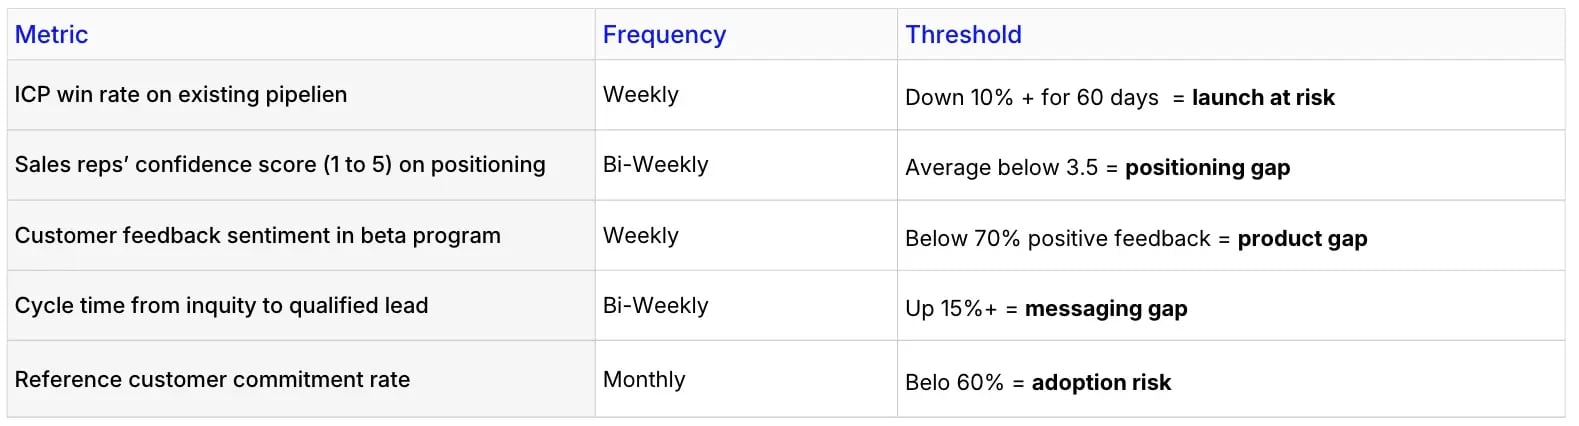
Exhibit 2: The success metrics as leading indicators of launch failure
A successful product launch strategy tracks all five leading key performance indicators in a single dashboard with named owners. Cross-functional teams review them weekly. The launch date holds only if the metrics stay green for three consecutive weeks.
Defining success this way prevents teams from declaring victory based on launch day press coverage and missing the early signs of revenue shortfall. This is what separates a successful product launch in industrial markets from one that looks fine for 90 days, then quietly misses its annual targets.
How customer feedback shapes positioning and messaging before launch
Customer feedback collected after launch is too late. By then, positioning and messaging are locked, marketing campaigns are running, and sales reps are mid-quarter. Customer feedback during the six-month pre-launch window has three jobs that directly shape launch execution:
#1: Pressure-test the unique value proposition. Ask 15 to 20 ideal customers one open question: what problem would this product solve for you? Record their language verbatim. Compare it to your value proposition. If their words don't match yours, the positioning needs rewriting before sales enablement, not after.
#2: Validate sales messaging in real sales conversations. Embed three messaging variants in 30 to 50 active deals. Track which variant correlates with shorter sales cycles and higher conversion. Sales reps run the test. Product marketing analyzes the data. This is sales enablement that actually moves numbers.
#3: Define product positioning against substitute behavior. Customer feedback often reveals that the real competitor isn't another vendor. It is a workflow workaround, a spreadsheet, or doing nothing. Define product positioning against the real alternative, not the imagined one.
Each of these methods gathers feedback that rewrites the launch deck, the email sequences, and the content marketing assets before they are published. Smart decisions about positioning and messaging start with customer language collected in the last 90 days, not internal brainstorms.
A new product launch checklist for industrial teams
Most new product launch checklists are activity checklists: Press release drafted, sales deck approved, landing page live, paid ads scheduled.
That measures preparation, not readiness. A successful product launch in industrial markets requires a readiness checklist, not an activity checklist. Here is the readiness version of a product launch checklist for industrial teams, built as a comprehensive plan against the six signals above (Exhibit 3).
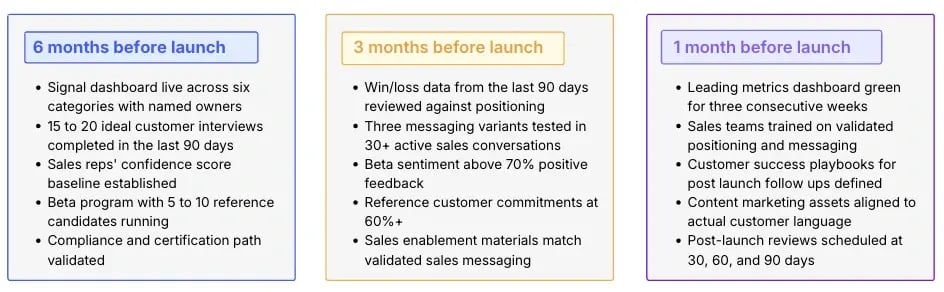
Exhibit 3: A new product launch checklist for industrial teams
Each item has a green/red status. The launch date holds only when all critical elements are green. This is not gatekeeping. This is efficient resource allocation. Pulling the launch by 30 days costs less than a launch that misses revenue targets by 40%.
Building a compelling value proposition that holds at launch
Most product launches build the value proposition from product features. The product team lists capabilities. Product marketing turns them into benefits. The launch deck goes to sales reps. Sales reps deliver it. Conversion underwhelms.
The fix: build the unique value proposition from the gathered feedback collected in the last 90 days. Use the exact phrasing customers used.
Three tests for a compelling value proposition:
#1 Substitution test. Replace your product name with a competitor's. Does the value proposition still hold? If yes, it is not differentiated.
#2 Specificity test. Does it name a specific outcome with a number or measurable change? If not, potential customers cannot evaluate it.
#3 Customer recognition test. Read it to 10 ideal customers. Do they recognize their own situation? If fewer than 7 do, rewrite it.
The compelling value proposition is the source document for all marketing efforts, sales messaging, and content marketing.
-
Get it wrong, and every downstream asset is wrong.
-
Get it right, and sales conversations get shorter, sales goals get more reachable, and a successful product launch starts generating a qualified pipeline within 30 days.
How ITONICS connects portfolio signals to a successful product launch
Industrial product launches fail when signal data lives in separate systems. Trends in one tool. Patents in another. Pipeline in CRM. Customer feedback in support tickets. Win/loss in spreadsheets. Nobody sees the same direction because nobody is on the same page.
ITONICS provides the operating infrastructure that connects these signals to launch decisions. Not as another innovation tool. As the system of record where strategy, trends, ideas, technology, portfolio, and execution share one data model.
What this looks like in practice:
- Signal monitoring across patents, publications, startups, and regulatory sources feeds the same workspace where product portfolios live
- Portfolio scoring updates automatically when underlying signals shift
- Launch readiness dashboards pull from the same data that the foresight team monitors
- Cross-functional teams across product, R&D, strategy, and sales work from one signal interpretation
- Product launch plans become live artifacts updated as signals move, not static documents built once at portfolio approval
This is what customers describe as innovation as a real system, like CRM is for sales or ERP is for operations. For product development teams running industrial product launches, this means fewer launches that miss revenue targets because the portfolio missed the signals. The data is already in the company.
ITONICS makes sure it reaches the launch decision before launch day, not in the post-launch review. A successful product launch in industrial markets is no longer a function of execution heroics. It is a function of whether the launch plan was built on current signals or on assumptions six months out of date.