8 R&D pipeline management practices that end stalled projects


About 73 percent of product developers in the United States run some form of stage-gate process, according to research cited by the Product Development and Management Association. That number proves the process is standard practice, not that it works. Most of those pipelines still stall between gates, and the reason has less to do with the process than with the data feeding it.
R&D pipeline management is the set of stages, gates, and status data that carries a project from idea to launch. Most stalls trace back to untrustworthy status data. Missing stages rarely cause the delay.
Status reporting near a gate skews optimistic. Flagging risk close to a funding review invites scrutiny. So risk surfaces late, and dashboards read green until a project misses its date.
This guide is for R&D portfolio managers, engineering leads, and program managers running research and development projects through a phase gate process. It covers the five stages of the project lifecycle, the eight practices that keep status honest, and the criteria that make those practices stick. Get pipeline status right, and resource allocation, budget management, and gate decisions all move faster.
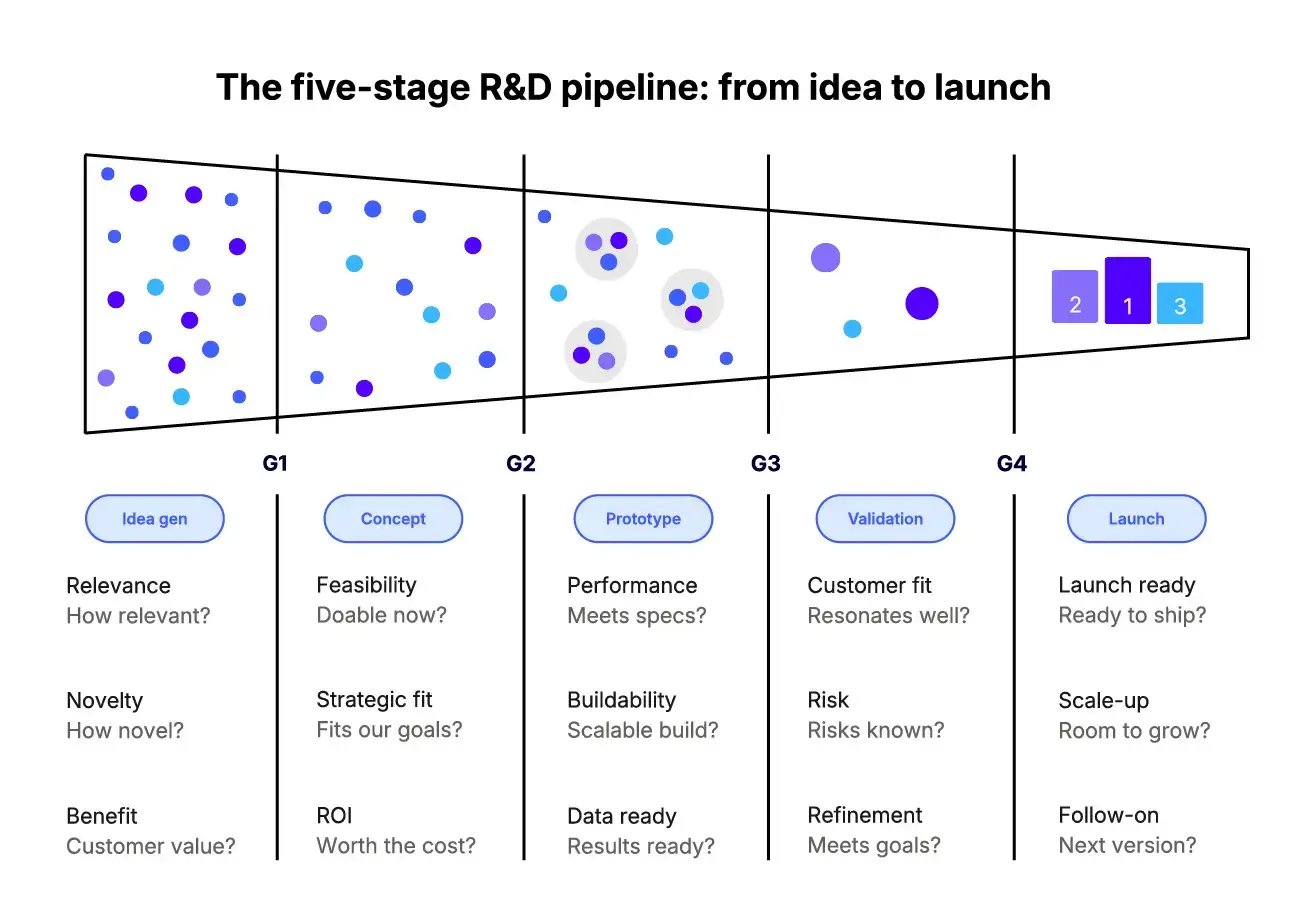
Exhibit 1: Each of the five stages ends at a gate with its own criteria, from relevance at intake to launch readiness at commercialization.
R&D pipeline management connects ideas, funding, and launch
R&D pipeline management covers everything between a new idea and a final product, shaping project efficiency and project outcomes along the way. It includes intake and scoring, resource allocation and capacity planning, project management execution, and tracking progress through each gate.
A project team owns the work inside a stage. Project stakeholders, often a steering committee and a sponsor, own the decision at the gate. Project managers coordinate between the two, translating project requirements into a plan that survives contact with the project environment: competing priorities, resource management across shared teams, and the other development projects running at the same time.
The biggest challenge is trusting the status a project team reports about its own project. Defining project objectives and scope, conducting risk assessment, and coordinating cross-functional teams all matter, each covering various aspects of a project that a single status field can't capture, but they all run on whatever status data leadership sees. If that data reflects hope more than progress, informed decisions become impossible, and every downstream decision inherits the distortion.
Pipeline management governs how one project moves through stages and gates. R&D portfolio management governs which strategic initiatives across project portfolios get funded, paused, or scaled. That decision layer is covered in this companion guide to R&D portfolio management.
Strategic portfolio management sits a level above both, connecting portfolio calls to strategic objectives and cross-portfolio strategic alignment. The complete guide to strategic portfolio intelligence covers that full model.
Whichever layer is making the call, the decision is only as good as the status feeding it. That status gets generated at five predictable points in every project's life.
Every R&D pipeline moves projects through the same broad structure across different phases, whether the output is a physical product, software, or a breakthrough innovation with no clear precedent.
Idea generation and scouting. New ideas enter the pipeline through market research, a scouting team's work, or internal submissions, in the initial stages of the innovation journey. Traditional projects skip this stage because the requirement already exists. R&D projects rarely get that luxury.
Concept and feasibility. Teams assess technical feasibility, expected ROI, market needs, and fit with business goals. This is where a business case gets built and tested against the gate criteria the project will face later.
Prototype development. Teams develop products fast enough here to test performance and manufacturability. This stage produces the deliverables, data and research results, that the next gate will evaluate.
Validation and testing. Prototype testing with customers happens here, alongside assessing potential risks and refinement against project goals. This stage catches problems that internal review alone misses.
Commercialization and scaling. The final product launches, extending existing products or introducing innovative products to the market. Future versions and follow-on projects often start scoping here, before the current project even closes.
Each stage involves cross-functional work and clear communication to reduce risk and produce a deliverable senior leaders can evaluate at the next gate. Skipping a stage moves its risk further downstream, where it costs more to fix.
Every stage ends the same way: a gate, and a status report that decides whether the project passes through it. That report is where the whole system tends to break down.
A project team preparing for a gate review has an incentive to look ready. Flagging a real risk two weeks before a funding decision invites a harder conversation than waiting until after the gate passes. Multiply that incentive across every team running multiple projects at once, and a portfolio-wide pattern emerges: status looks best exactly when scrutiny is about to increase.
The phase gate process was built to prevent this. Decisions at each gate can include advancing, pausing, or terminating a project, with resource allocation routing toward the highest-potential projects at that checkpoint. Senior leaders monitor progress against predefined criteria, and quality control checkpoints confirm a project is actually ready to proceed.
None of that works if the evidence going into the gate comes only from the team being reviewed, since outside sources add valuable insights precisely because they carry no incentive to inflate progress. Fixing that means changing how status gets created, not redesigning the gates themselves. Eight practices do that.
Score new ideas against the stage-gate process. New ideas get evaluated against the same criteria used at every later gate, not a lighter version meant to attract more submissions. A shared rating scale locks scope before funding, so a project keeps its original territory once a business case is approved.
Tie roadmaps directly to business objectives and the business case. Anchor every roadmap milestone to a business objective, not just a date. A roadmap view built on well defined schedules turns a delay into a visible strategic risk for leadership, not just a red flag on a chart.
Build customer involvement into concept and validation. Bring customer feedback into the concept and validation stages, ahead of launch rather than after it, and log it against the concept it relates to. Prototype testing with customers gathers input while changes are still cheap, and acceptance testing confirms the final product meets what customers actually need before it ships.
Let capacity planning allocate resources across multiple projects. Plan capacity before commitments outpace what development teams can deliver, and allocate resources effectively across the full set of active projects rather than one at a time as requests arrive, treating resource management as a portfolio-wide discipline rather than a per-project afterthought. A board with workload aggregated by team or swimlane makes that capacity visible before it becomes a conflict.
Force cross-functional teams to surface handoff risk. Make the handoff between cross-functional teams, R&D to manufacturing, or R&D to regulatory, a visible step, since that is exactly where risk most often goes missing from a status report. A workflow with a defined handover point between departments keeps that step from disappearing.
Source gate evidence outside the team under review. A team evaluating its own progress is prone to optimism bias, even with no intent to mislead anyone, so bring in outside experts, finance, market intelligence, an independent scouting group, to pressure-test the evidence before it reaches the gate. That collaboration catches blind spots a team too close to its own project won't see on its own.
Automate status pulls with integrations and AI agents. Connect gate reviews directly to the tools a project team already uses, instead of asking that team to fill out a separate status form. AI agents can now monitor those connected systems continuously and flag drift between what was reported and what the underlying data actually shows, so decisions stop depending on whether someone is willing to admit a project is behind.
Audit status accuracy through continuous improvement. Audit status accuracy with the same rigor applied to throughput, checking whether what was reported at each gate matched what actually happened next. An audit trail turns continuous improvement into a measurable habit, and each cycle makes the next round of objective decisions easier, compounding into long-term success.
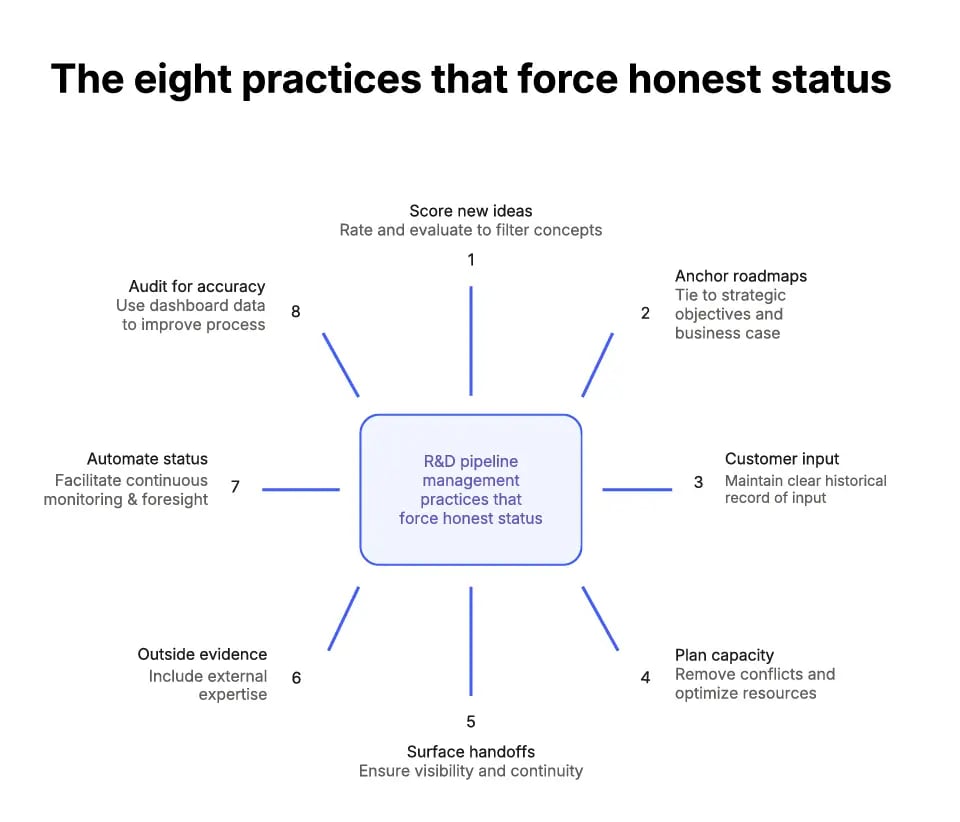
Exhibit 2: Each of the eight practices anchors a specific fix, from filtering ideas at intake to using dashboard data to improve the process over time.
Each of these eight practices takes ongoing effort to sustain. A project team scoring new ideas against gate criteria in the first quarter often reverts to informal judgment by the third, once the person who insisted on the rigor moves to a different project.
Practices survive when something other than individual discipline enforces them. That means gate evidence gets pulled automatically through configured workflows, capacity gets recalculated on a schedule nobody has to remember, and status updates come from a system instead of a person's judgment about how the update will land.
That system is pipeline software. Not every tool marketed that way actually tracks status automatically, logs gate decisions with evidence, or flags drift on its own.
Look for execution tools that connect with the different tools development teams already touch, not a form filled out separately. At minimum, it should:
Point tools like spreadsheets or Microsoft Project can list tasks and dates, but few log gate decisions with evidence, flag drift on their own, or integrate cleanly with other tools already in use. Efficient management of a growing project set depends on all three capabilities working together, and the numerous benefits of a connected system only show up once they do.
PMI's 2026 Pulse of the Profession report, surveying project professionals on how they manage complex projects, found that teams backed by a PMO rated their complex-project management as very or extremely successful 63 percent of the time, against 57 percent for teams without one. The PMO plays a crucial role in that gap, enforcing the frameworks and sponsor alignment that structure alone can't guarantee.
The same report found that 31 percent of complex projects fail to achieve their full intended benefits, more than twice the failure rate for projects generally. The gap traces back to the same root cause this guide opened with: structure that exists on paper but isn't enforced in practice.
Connected pipeline software delivers four returns on top of that structure:
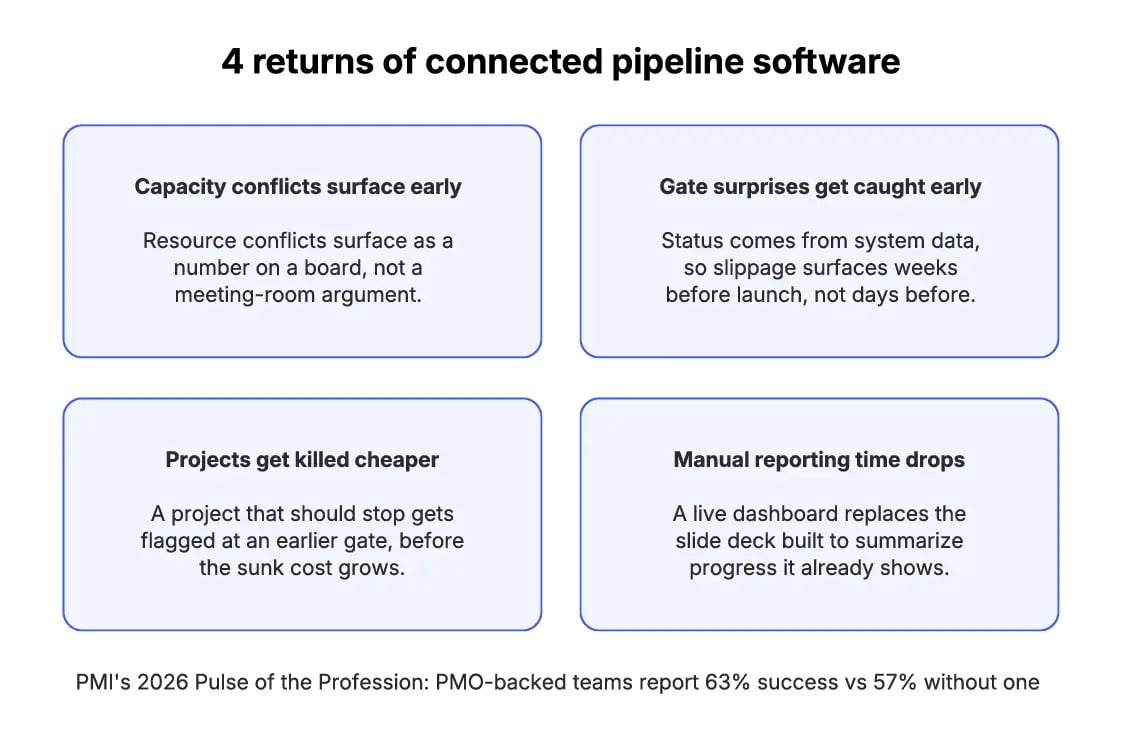
Exhibit 3: Capacity conflicts, gate surprises, kill decisions, and reporting time all improve once status comes from system data instead of a team's own account.
Start with one gate, not the whole pipeline:
The gap between them is usually the clearest argument for rolling the system out further.
GOLDBECK and Sartorius each ran that comparison at scale, from two different starting problems.
GOLDBECK. The construction company runs 500 projects a year, exactly the scale where capacity planning across multiple projects stops being optional. For years, departments scouted startups and tested new tools independently, with no shared view of who was talking to which vendor.
Cross-functional teams had no way to surface the risk of the same startup pitching five departments at once. Work got duplicated, and information got lost.
GOLDBECK fixed this by sourcing gate evidence outside the team under review. A network of 18 trained Ambassadors, independent of any single department, now feeds one system. Entries move through the same stage-gate process every new idea gets scored against.
The company has since screened more than 1,600 startups and tracked 280 use cases across 32 search fields, with 240 users drawing on the same data instead of dozens of separate channels. The transparency problem, not any missing framework, was what stalled visibility in the first place.
Sartorius. Sartorius's Corporate Research division shows the payoff of forcing cross-functional teams to surface handoff risk instead of letting it disappear across time zones. The team connected 60 members across multiple product development areas to one platform, centralizing scouting, sharing, and discussion to keep open communication flowing between geographically distributed groups instead of losing handoffs in translation.
The team has since assessed 400 technologies and identified 450 collaboration opportunities with startups and academic groups, all visible in the same system instead of scattered across departments and time zones. According to Sartorius's own account, the platform let the team gain a holistic view of its work rapidly, exactly the kind of cross-team visibility a shared handoff point creates and a fragmented one leaves out.
GOLDBECK solved a transparency gap. Sartorius solved a distance gap. Both closed it the same way: one system that every team feeds and every gate decision draws from.
Neither GOLDBECK nor Sartorius closed their gap by asking teams to self-report more diligently. Both replaced self-reporting with a system that captures and consolidates status as a byproduct of the work itself.
ITONICS is that system. It gives each of the eight practices that force honest status a permanent home in the platform, supporting data-driven decisions rather than leaving accuracy to individual discipline.
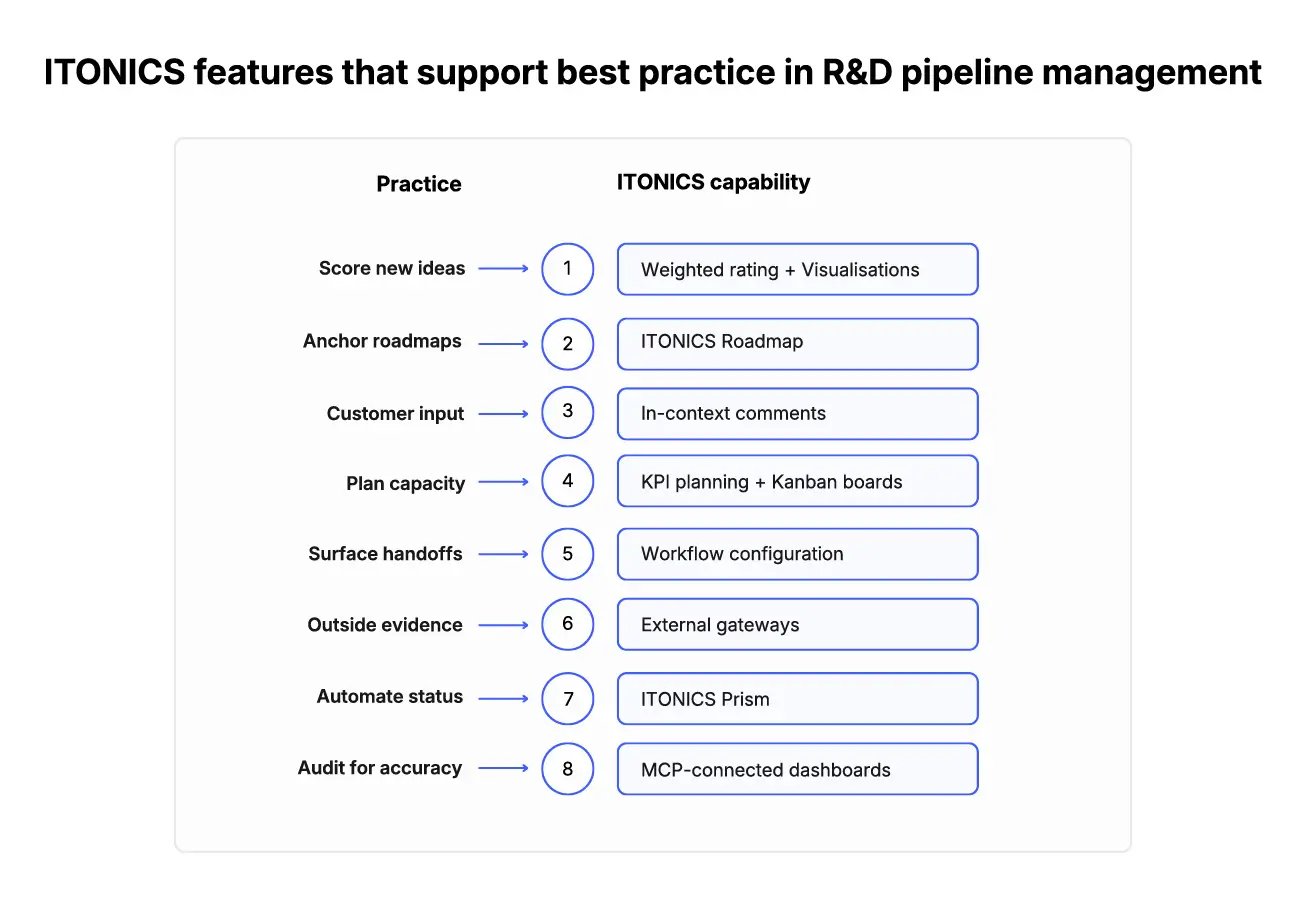
Exhibit 4: Each of the eight practices has a permanent home in the platform, making pipeline status a single source of truth from intake to the final audit.
Practice 1: Score new ideas → Standard, numerical, or aggregated ratings apply the same weighted criteria at intake that later gates will apply, locking scope before funding is approved and feeding straight into radar and board visualizations.
Practice 2: Tie roadmaps to objectives → The Roadmap view anchors every milestone to a business objective, and status-change notifications alert stakeholders the moment a milestone slips, so a delay reads as a strategic risk, not a scheduling footnote.
/Still%20images/Roadmap%20Mockups%202025/portfolio-visualize-critical-paths-2025.webp?width=1440&height=900&name=portfolio-visualize-critical-paths-2025.webp)
Exhibit 5: Roadmap with projects and milestones showing schedule conflicts
Practice 3: Build in customer involvement → In-context comments and a collaboration audit trail replace scattered email chains, linking customer feedback and expert input directly to evaluation scores and go/no-go decisions.
Practice 4: Plan capacity across projects → Kanban boards aggregate workload by team or swimlane, using KPIs like Resource Effort in Weeks configured directly on each project, so capacity conflicts surface as real numbers before they harden into commitments.
Practice 5: Surface handoff risk → Gates assign named reviewers, set required approvals before advancing, and log every decision, so a handoff between departments is a visible step instead of a blind spot.
Practice 6: Source evidence outside the team → External gateways let outside collaborators, finance, market intelligence, and an independent reviewer contribute directly, so gate evidence never rests on self-assessment alone.
Practice 7: Automate status pulls → Prism, ITONICS's context-aware AI, evaluates projects against external intelligence and strategic priorities when prompted, flagging drift between reported status and the underlying data.
Practice 8: Audit for accuracy → MCP-connected dashboards track gate outcomes over time, so drift between what a gate approved and what actually shipped drives corrections to the next cycle, not just a record of what went wrong.
Configured once, these settings apply to every project without requiring anyone to remember to apply them. Status stops being a claim a team makes and becomes a record the system keeps.
That is the shift this guide has been building toward. A stage-gate process running on unverified status data reports optimism, not progress. Connect the gate to the underlying data, and the dashboard shows what is actually happening, not what looked safe to report two weeks before the review- the foundation for long-term success rather than short-term optics.