6 technology innovation strategies: Relevance, costs, and benefits


Technological innovation is the innovation investment strategy that promises the highest and longest returns. The risk and uncertainty embedded in technological development act as a filter to crowd out competition and create unique market positions. At the same time, the absence of a clear strategy bears the highest risk of wasting resources.
Most enterprises already run several technology innovation strategies in parallel. Few leadership teams can state which strategy each program follows, what it costs, and what it signs away. That gap produces stranded investment that still reports progress every quarter.
Two decisions generate all six strategies: where the technology comes from, and which business it serves. This article covers each of the 6 technology innovation strategies, their cost structure, the conditions where it fits, and the point where it breaks.
| Strategy | Best for | Example |
| Optimization strategy | Own development to support core process improvements | Amazon's ML for logistics |
| Proprietary strategy | Proprietary platform development for new markets | Meta's VR/metaverse R&D |
| Extension strategy | Improve platforms with partners | SIEMENS and IBM for AI in operations |
| Risk sharing strategy | Share risk and expertise in breakthrough technology development | Pfizer and BioNTech for mRNA development |
| Adoption strategy | Fast adoption of proven technologies in core business | Walmart buying XR start-ups for retail |
| Fast expansion strategy | Fast adoption of proven technologies to enter new markets | Microsoft investing in OpenAI |
Exhibit 1: Overview of the 6 technology innovation strategies
Martec's law, formulated by Scott Brinker in 2013, holds that technology changes exponentially while organizations change logarithmically. The gap between the two rates widens every year, and it caps how much change a company converts into results.
The binding constraint is absorption capacity rather than budget. Amazon acquired Kiva Systems for $775 million in 2012 and reached one million deployed robots in July 2025, across more than 300 facilities. Thirteen years separated the capability purchase from the operating milestone.
Leadership therefore allocates against two variables: how fast a technology matures, and how fast the organization redesigns work around it. Every program answers those two questions, whether an executive decides them explicitly or a project team decides them by default. The 6 technology innovation strategies formalize both answers into one allocation decision.
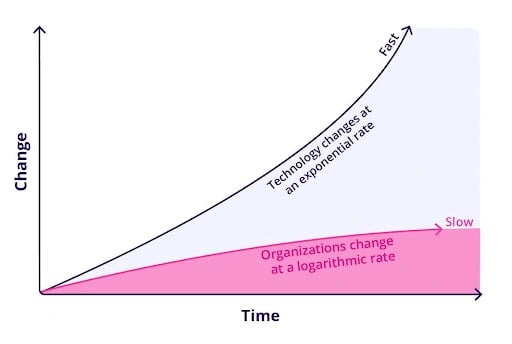
Exhibit 2: Martec's Law and the technology change paradox
Three patterns account for most of the waste in technology innovation strategies. Each traces back to a cell that got assigned by default.
Building what the market will sell you in three years
Teams begin internal development while a technology sits on the steep part of its S-curve. They ship after vendors have commoditized the same capability. The build cost stays on the balance sheet, and the differentiation evaporates.
To avoid building what the market will sell you in three years, count credible vendors serving your specific use case at the moment you sign off the build. Three or more vendors turn the build-or-buy decision into a cost center with a permanent support obligation.
Co-development reads as capital efficiency. It also fixes your upside at the moment the bet lands, at the scale the Pfizer and BioNTech figures below show.
To identify whether partnering is the right approach, ask which party would fund the program alone at twice the cost. A partnership that survives that question is a strategy. A partnership that fails it moved an internal budget fight off the table.
Procurement cycles run in weeks. Process redesign runs in quarters. Tools arrive, workflows stay in place, and the licence renews on a capability that stayed on the shelf.
To ensure adoption capacity, count concurrent technology programs per business unit. Cap the number, then stage the remainder against release capacity rather than vendor availability.
Two decisions are the baseline for all 6 technology innovation strategies:
Decision one sets the sourcing mode: build internally, partner with a company holding a complementary asset, or buy access through acquisition, licensing, or equity.
Decision two sets the target business: the technology either improves the business you operate today or opens a market you plan to enter.
Three sourcing modes across two target businesses produce six cells. Every technology program occupies exactly one. Once you name the cell, the cost structure, governance model, and exit criteria follow from it.
Each of the 6 technology innovation strategies carries a distinct capital profile and a distinct trade-off. Exhibit 3 sets them side by side, and the sections below cover the mechanism, fit conditions, and breaking point of each one.
| Strategy | Capital profile | Time to value | What you trade away |
|---|---|---|---|
| Optimization | Sustained internal opex plus capitalized R&D | 12 to 36 months | Opportunity cost against other internal bets |
| Proprietary | Largest of the six, loss-making by design | 5 to 10 years | Balance sheet flexibility for a decade |
| Extension | Low capital, shared integration cost | 6 to 18 months | Unilateral roadmap control |
| Risk sharing | Low upfront, high contingent | 12 to 48 months | Half the upside in the success case |
| Adoption | Smallest of the six | 3 to 12 months | Differentiation, since rivals buy the same asset |
| Fast expansion | Large equity or licensing outlay | 6 to 24 months | Control of the underlying asset |
Exhibit 3: Cost structure and trade-off by strategy
Mechanism. Internal development that improves processes you already run at scale.
Cost profile. Sustained engineering opex plus capitalized R&D, with measurable gains inside 12 to 36 months.
Fits when. You hold data or operational scale that a vendor has no route to replicate, and the improvement compounds with volume.
Breaks when. The capability ships as a product from three or more vendors while your differentiation sits downstream of it.
Evidence. Amazon bought its fleet capability in 2012 and built the intelligence layer 13 years later. By July 2025 it ran one million robots across 300-plus facilities, with 75% of global deliveries receiving robotic assistance. It then launched DeepFleet, a generative AI foundation model that coordinates fleet movement and improved robot travel time by 10%. DeepFleet trains on Amazon's own inventory movement data, an asset no supplier holds.
Mechanism. Internal platform development aimed at a market you intend to define and own.
Cost profile. The largest commitment of the six. Losses run by design across 5 to 10 years.
Fits when. The platform becomes your future core business and a profitable existing business funds it without covenant pressure.
Breaks when. Adoption arrives later than the funding thesis assumed, and the loss run rate compounds while revenue stays flat.
Evidence. Meta's Reality Labs has accumulated $83.6 billion in operating losses since late 2020 against $11.8 billion in cumulative revenue. The 2025 operating loss reached $19.2 billion on $2.2 billion of revenue, close to 10% of Meta's roughly $201 billion in annual revenue. Meta has since redirected most Reality Labs investment toward glasses and wearables, and Mark Zuckerberg stated that 2026 losses will likely mark the peak.
Price a proprietary strategy as a decade-long claim on free cash flow, then hold the ceiling you set.
Mechanism. Integrate a partner platform to extend your own into adjacent workflows for the customers you already serve.
Cost profile. Low capital, shared integration expense, 6 to 18 months to a joint offering.
Fits when. Both companies sell to the same buyer and each owns a component the other would spend years rebuilding.
Breaks when. Roadmap control outweighs speed, because joint delivery synchronizes two independent release cycles.
Evidence. Siemens Digital Industries Software and IBM connected the Siemens Xcelerator portfolio and Teamcenter with IBM Maximo for service lifecycle management in June 2020. In April 2023 they extended the partnership into systems engineering, linking IBM Rhapsody with Teamcenter and Siemens Capital, and later into SysML v2 modeling. Each company kept its own platform and met at the integration layer to close the design-to-service digital thread.
Mechanism. Split development cost and technical risk on a technology neither party carries alone at the required speed.
Cost profile. Low upfront, high contingent. Both sides exchange upside for downside protection.
Fits when. The timeline is compressed, technical risk is high, and the capability gaps are complementary rather than overlapping.
Breaks when. The program succeeds far beyond the case that justified sharing.
Evidence. Pfizer funded 100% of BNT162b2 development costs upfront in 2020, with BioNTech repaying its 50% share during commercialization. Pfizer contributed clinical development, regulatory capability, manufacturing, and distribution. BioNTech contributed the mRNA platform. The structure delivered a vaccine inside a year and gave BioNTech half of gross profit on a product that generated close to $37 billion for Pfizer in 2021.
Model the success case before you sign. Risk sharing pays for itself when the program lands at the median outcome and costs the most when it lands at the top.
Mechanism. Acquire or license a proven capability and deploy it into the existing business.
Cost profile. The smallest of the six, with deployment inside 3 to 12 months.
Fits when. The technology already works, and your advantage comes from deployment scale rather than invention.
Breaks when. Competitors buy the same asset, which limits differentiation to one procurement cycle.
Evidence. Walmart acquired VR software studio Spatialand in February 2018 through its Store No. 8 incubator, bringing in roughly 10 employees on undisclosed terms reported as small. Store No. 8 added Aspectiva in February 2019, whose machine learning and natural language processing later fed generative AI applications in back-of-house operations. Walmart closed the incubator in January 2024 and moved around 300 people into core technology and innovation operations.
A retired vehicle after capability transfer is a completed adoption cycle. Judge the strategy by what moved into the core, and by the capital exposed while you found out.
Mechanism. Use equity or licensing to acquire capability and market position simultaneously.
Cost profile. Large outlay, fast entry, revenue inside 6 to 24 months.
Fits when. A category leader exists and your distribution converts their technology into revenue faster than any internal program would.
Breaks when. You require control of the asset, because access agreements get renegotiated as the counterparty gains leverage.
Evidence. Microsoft committed $13 billion to OpenAI from 2019, of which $11.9 billion was funded as of June 30, 2026. Microsoft reported $24.1 billion in revenue attributable to OpenAI in fiscal 2026, and OpenAI committed to purchase a further $250 billion in Azure services. Following the October 2025 recapitalization, Microsoft held roughly 27% of OpenAI Group PBC, valued at $135 billion, reduced from a 32.5% stake. The April 2026 agreement moved the arrangement to non-exclusive licensing.
Fast expansion buys revenue, position, and time. Control stays with the counterparty, and dilution follows every subsequent funding round.
Selecting among the 6 technology innovation strategies takes four tests. Run them in order: test 1 sets the sourcing mode, tests 2 and 3 confirm or override it, and test 4 caps how many programs run at once.
Classify the technology as emerging, scaling, or mature, using vendor count as the proxy. Zero to two credible vendors for your use case keeps a build in play. Three or more moves the decision to buy or partner. Emerging technologies with no vendor product carry the only defensible case for an internal build. Building at maturity produces stranded investment with a permanent maintenance line.
Identify which P&L line the technology touches. Cost-base technologies go to the adoption cell against a payback threshold, 18 months as a working default. Differentiation technologies go to build or to a partnership with explicit IP terms, decided at board level rather than at program level.
Build the layer that sits on an asset competitors have no path to copy: proprietary process data, installed base, or operating scale. Amazon's fleet data qualifies. Where that asset is absent, a vendor out-develops your internal team, because they amortize the same roadmap across hundreds of customers. Apply this test to every build already funded in your R&D portfolio.
Apply Martec's law at the business unit level. Set a hard cap on concurrent programs per unit, then assign every program an owner, a budget line, and a written kill criterion before funding starts. Programs without a kill criterion consume budget for years at low intensity.
Cell targets belong inside the R&D budgeting cycle you already run. They add a second dimension to money that is already allocated, rather than a separate pot to fund. Business units keep their existing envelopes, cost centers, and stage-gate approvals, and every funded program carries one additional attribute.
Start with committed spend in the current fiscal year. Most of it is locked, which makes the first pass diagnostic rather than a reallocation. Tag each program, total the spend per cell, and compare the result against the strategy your executive committee approved. Where the optimization cell holds most of the total, the portfolio funds efficiency and reports innovation.
Five rules govern the allocation.
Choosing where and how to invest in technological innovation depends on clear signals and reliable tracking. The transition towards green and sustainable technological innovations is crucial to reduce reliance on fossil fuels.
The right tools help companies focus on what’s changing, what’s working, and what needs attention.
AI systems continuously monitor patents, research, and media to flag early signs of change. Generative AI is transforming content creation by producing sophisticated and human-like outputs such as text, images, audio, and video. This helps teams act on emerging technologies like natural language processing, generative AI, or augmented reality before they hit the mainstream. These alerts reduce guesswork and help avoid late or misaligned investments.
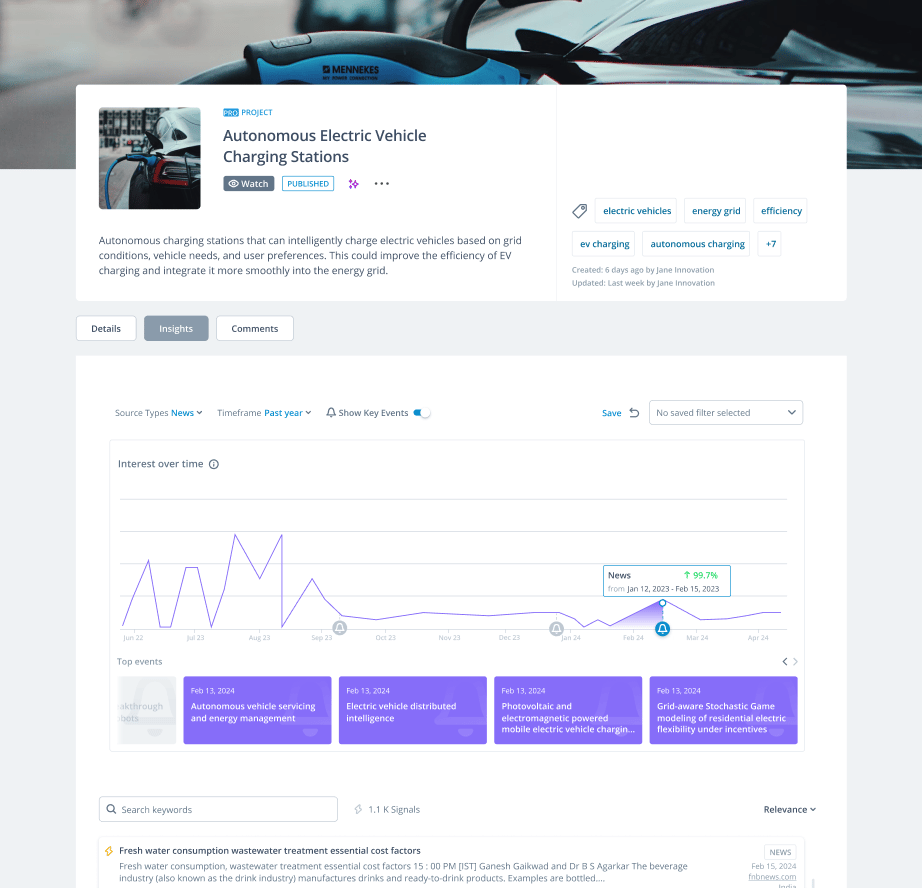
Exhibit 4: Signals of change monitoring inside ITONICS
In sectors like personalized medicine or internal processes, early signals can inform decisions about when to develop in-house or explore external partnerships. Alerts also support faster risk assessment and portfolio updates.
A technology radar shows where new developments stand and how they might fit into your strategy. Advancements in computer vision technology are enabling machines to process and interpret visual data. It brings together information on maturity, relevance, and urgency in a single, shared view.
This allows teams to compare options, whether it’s augmented reality, autonomous vehicles, or interconnected devices.
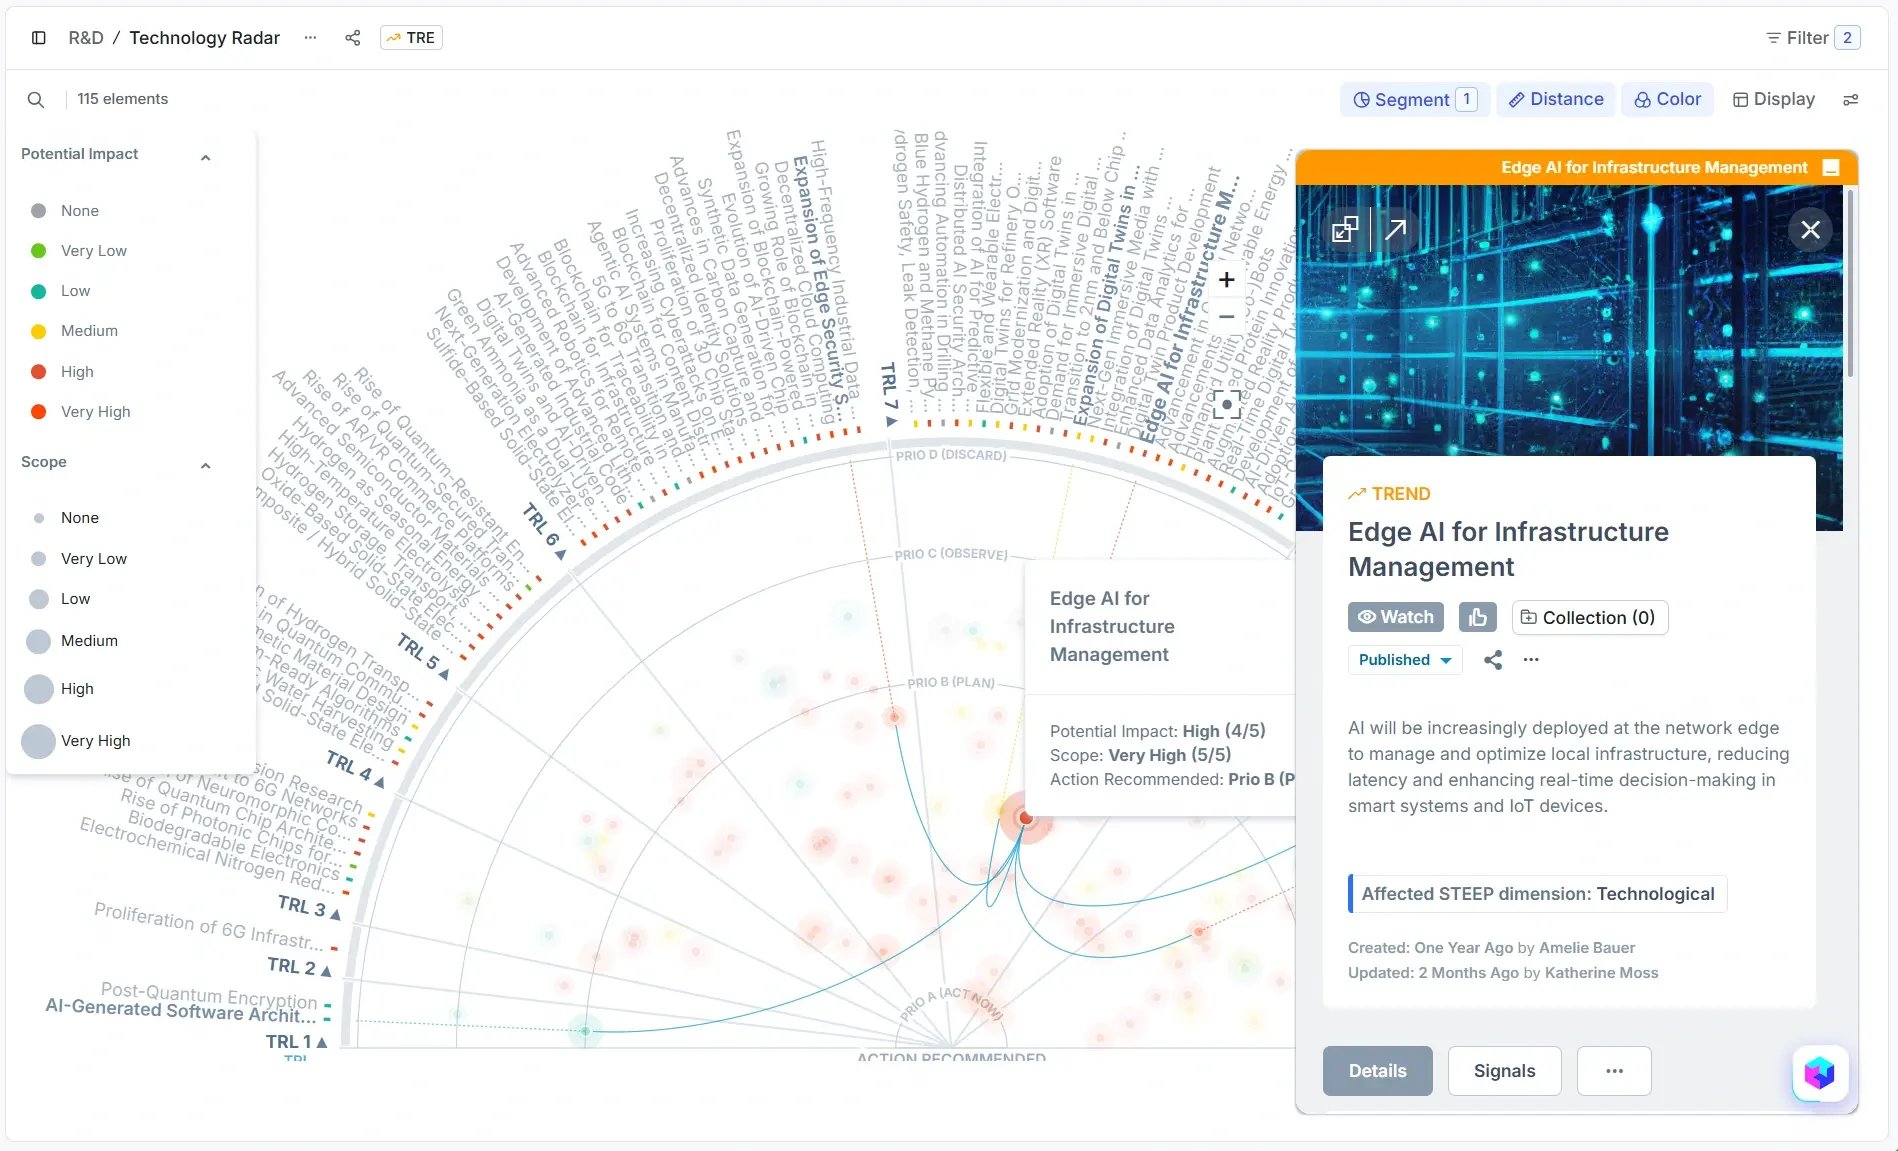
Exhibit 5: Technology radar inside ITONICS
Radars also help reduce blind spots. When teams use the same reference point, it’s easier to prioritize investments and align across business units.
Roadmaps show what needs to happen, when, and why. They connect long-term goals with near-term steps, outlining how technological innovation supports the business. Advancements in wind turbines are increasing efficiency and lowering costs, making them a key example of progress in renewable energy technologies.
For example, a technology roadmap might link data analysis tools to better decision-making in new industries or match R&D efforts to digital transformation strategies.
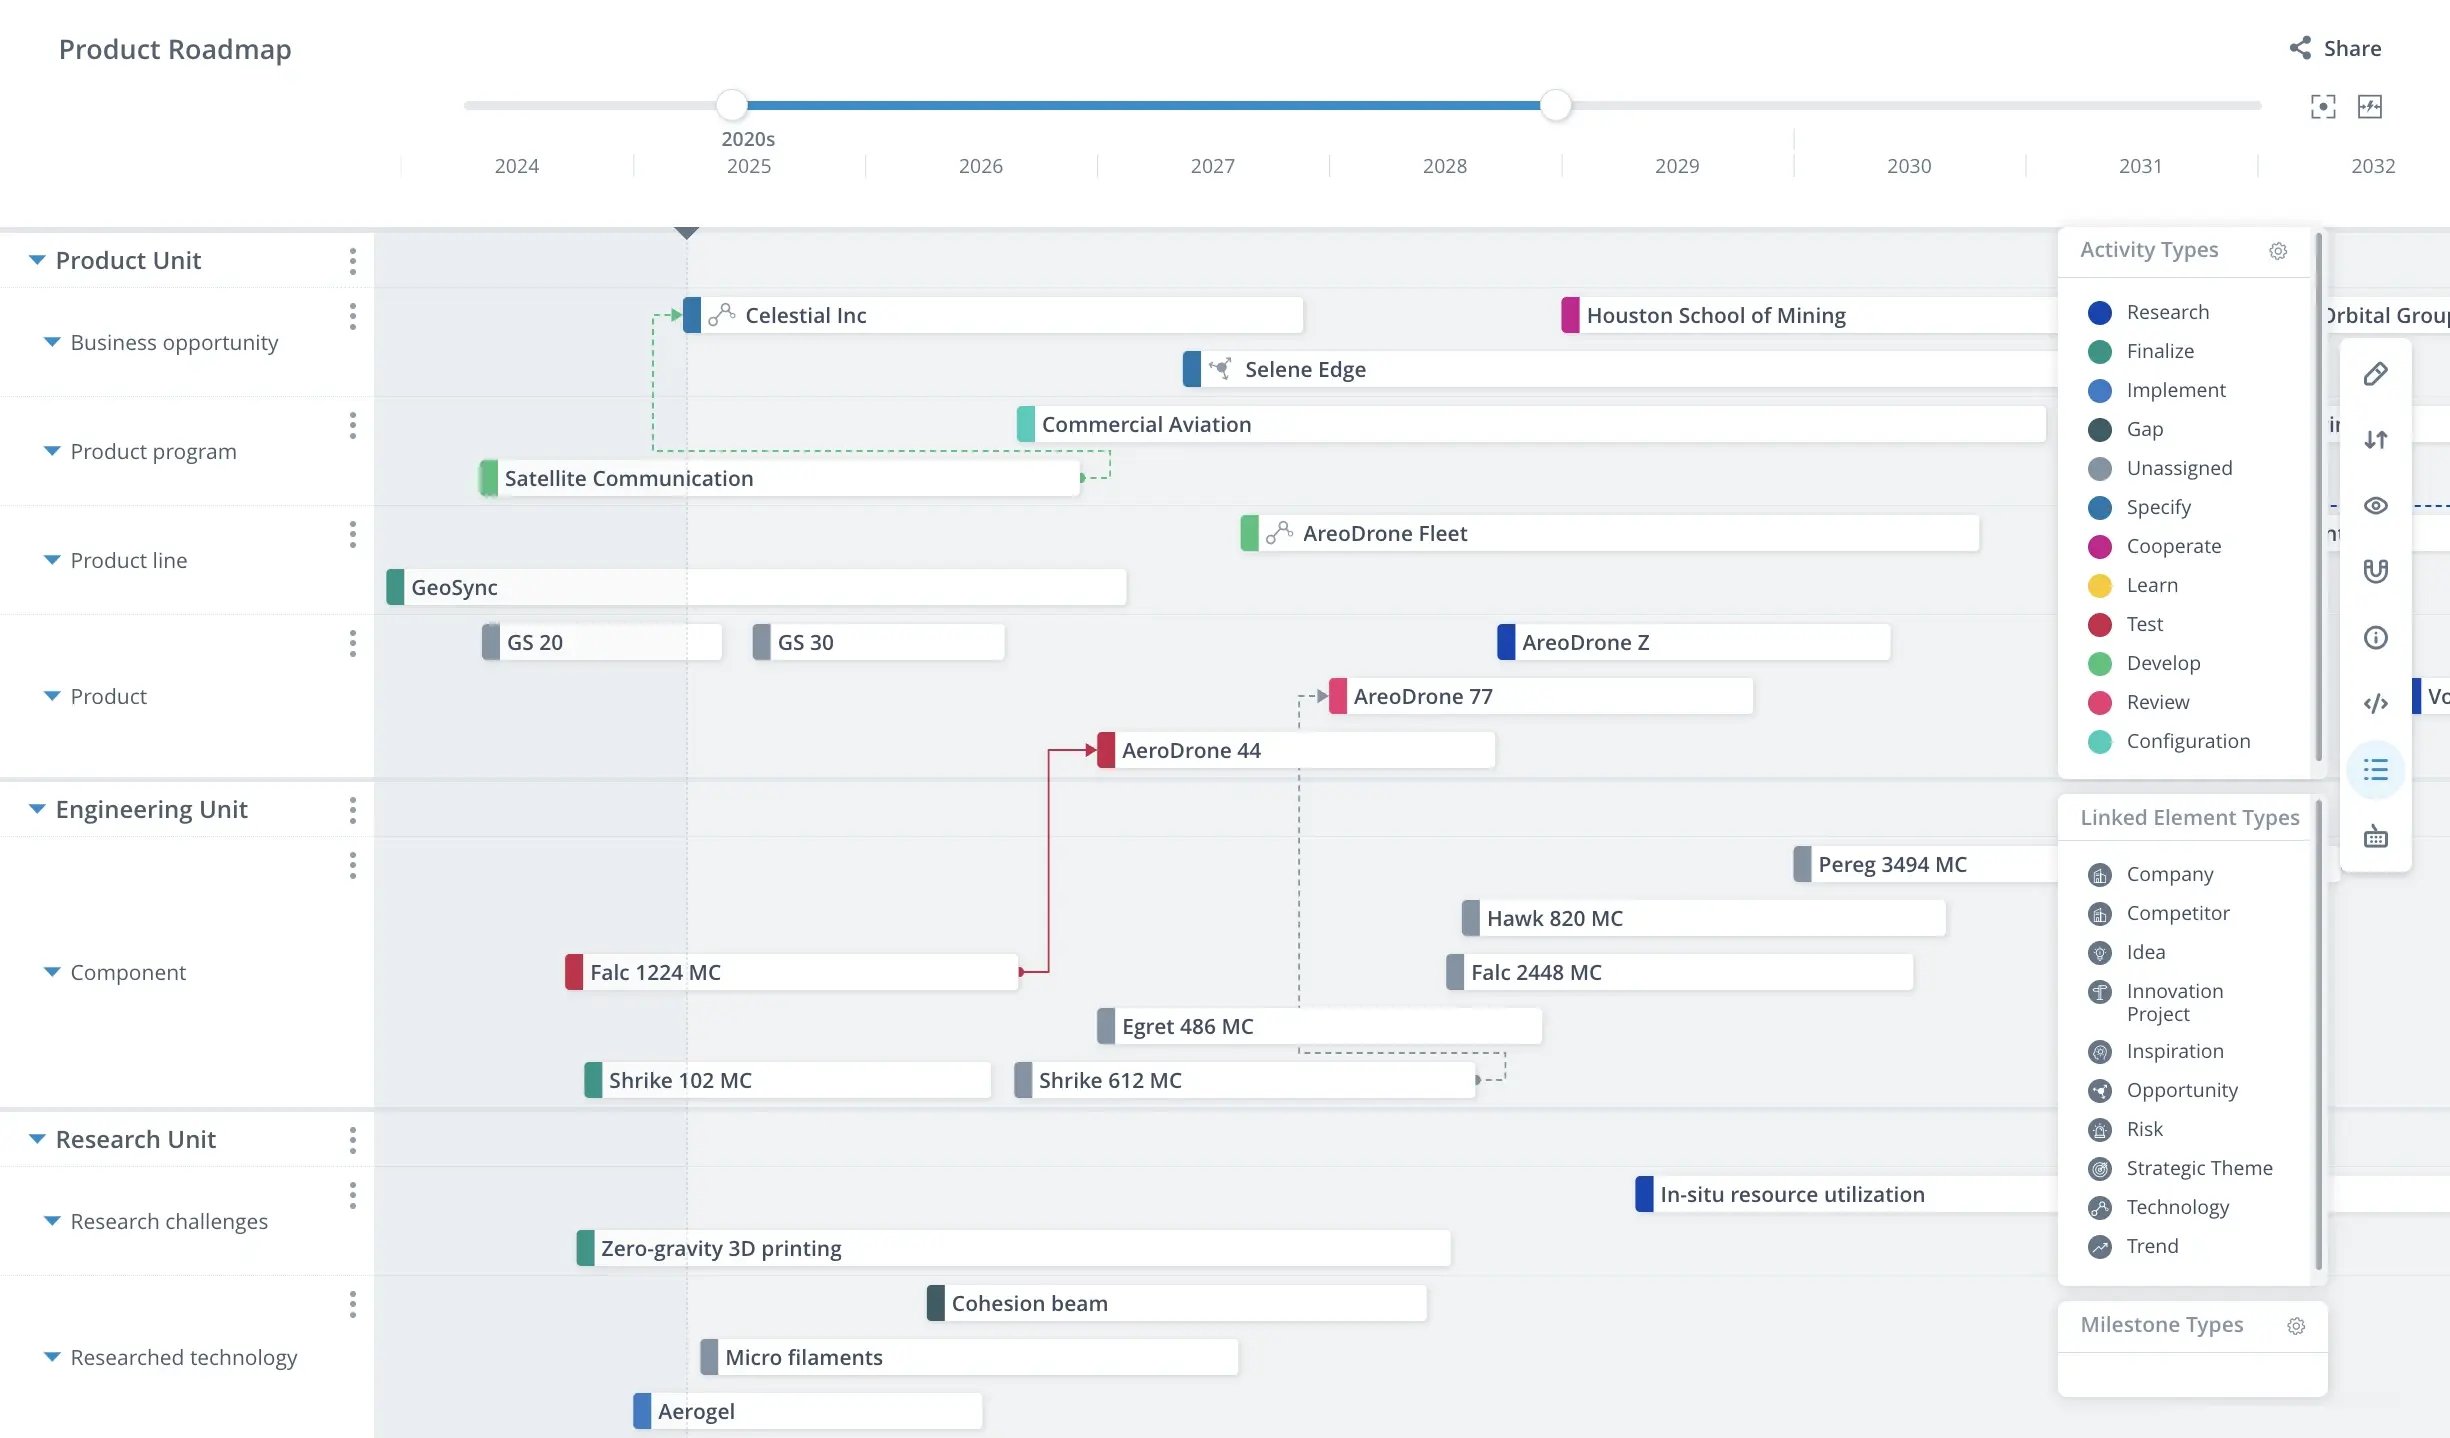
Exhibit 6: Technology roadmaps inside ITONICS
Good roadmaps are not static. They adapt as technology changes and help ensure that innovation projects stay on track.
Dashboards help you see where your resources are going. They show current spending, project owners, and timelines, making it easier to spot delays, gaps, or overruns. Energy storage plays a crucial role in addressing the intermittency issues associated with renewable energy sources, ensuring a reliable energy supply while advancing sustainability efforts.
If you’re testing a new technology in several sectors, dashboards keep things coordinated.
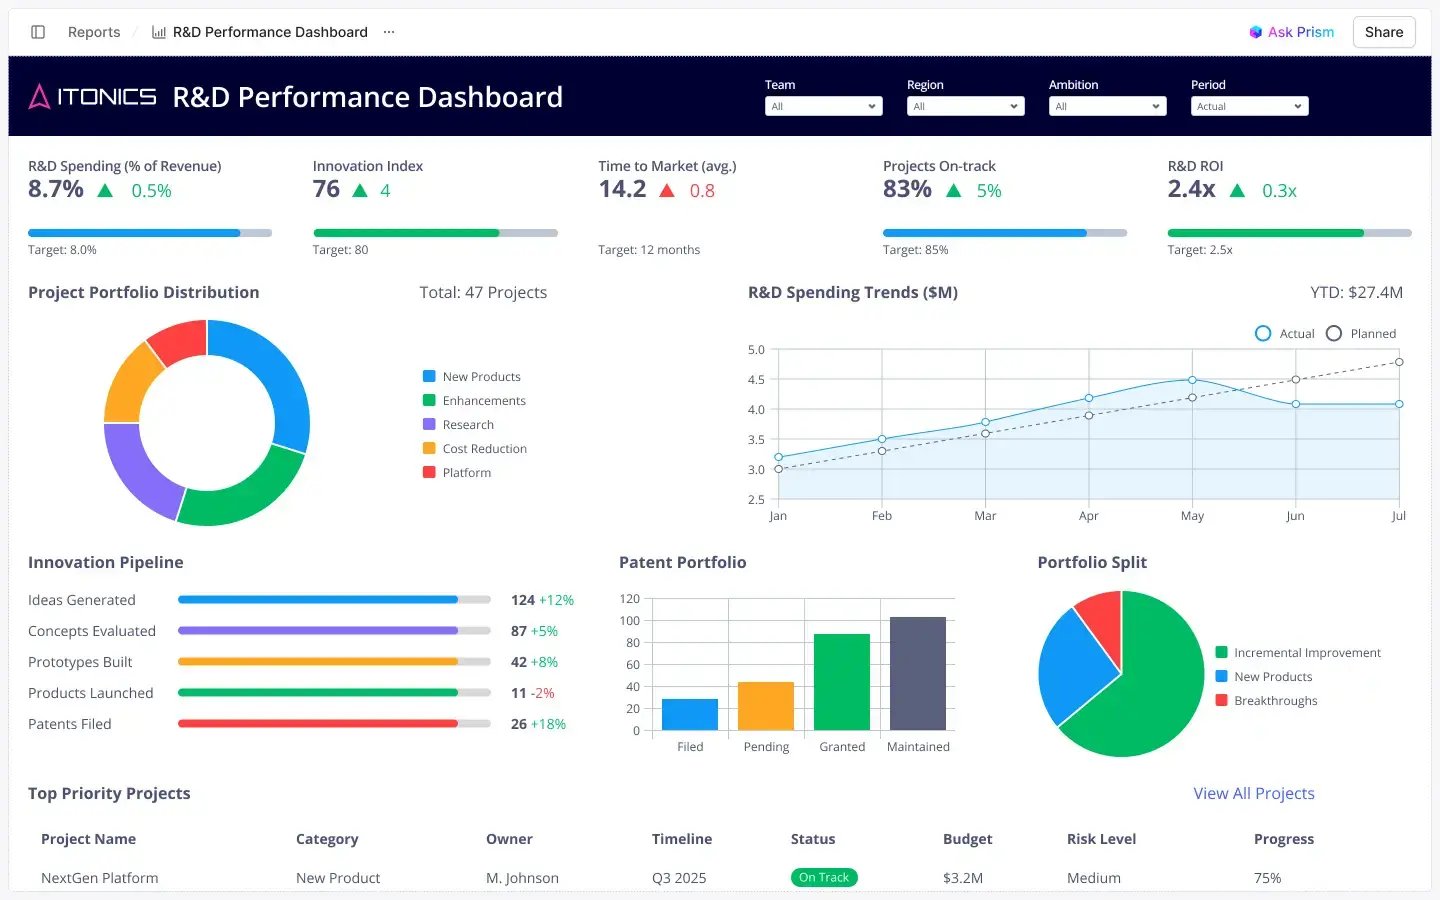
Exhibit 6: R&D performance dashboard inside ITONICS
You can also use them to monitor the impact of high-risk bets versus ongoing improvements, helping you manage innovation like a portfolio.
Creating and managing technological innovation strategies on slide decks and spreadsheets can be complex and time-consuming. By leveraging the best R&D management software, organizations can significantly ease the process of creating and managing their tech strategy.