70-20-10 model: How to set and track your innovation budget allocation


In two-thirds of ITONICS calls, innovation leaders struggle with the same question: where should the innovation money go? Put the money into today's business, and each extra euro buys less. Put it into breakthroughs, and you fund 70% of the long-term return on innovation investments. But breakthrough funding follows venture odds. About half of all investments lose money, and only 6% return ten times the amount invested. Whoever sets the split carries both the business risk and the personal career risk.
Our analysis of 2,193 ITONICS calls ranks portfolio prioritization as the second most mentioned challenge, after AI. That is surprising. Back in 2012, Nagji and Tuff showed that companies allocating close to 70-20-10 outperformed their peers, typically with a P/E premium of 10% to 20%. But that result is an average, so companies that copy the split as a fixed rule often overlook methods that fit their context better.
Our analysis adds a second dimension: tracking. In one call in five, buyers named Excel as their current tool. That means updates on innovation projects collected by hand, decisions that are hard to trace, and board reports rebuilt every quarter.
This article therefore explains when the 70-20-10 horizons framework model fits, how to run it in innovation portfolio management against your strategic objectives, and where other models and splits beat the average.
The table below summarizes the four established allocation models and the conditions each one fits.
|
Model |
Source |
Budget logic |
Best when |
|---|---|---|---|
|
70-20-10 |
Google (2004); Nagji and Tuff (2012) |
Target shares by ambition level, starting at 70% core, 20% adjacent, 10% transformational |
Core crowds out new business. You need a fixed share for adjacent and transformational bets. |
|
Strategic buckets |
Cooper, Edgett and Kleinschmidt (1997) |
Top-down envelopes per strategic priority |
Clear, diverse priorities. Your strategy names priorities too different to compare on one scale, so each gets its own protected envelope. |
|
Scoring models |
Cooper, Edgett and Kleinschmidt (2001) |
Projects ranked on weighted criteria and funded down the list |
Many similar bids. You must rank dozens of comparable projects on one scale. |
|
Metered funding |
Lean startup practice (Kromer, 2018) |
Budget released in phases against pre-defined metrics |
High uncertainty. Outcomes are too uncertain to forecast, so money follows evidence. |
Exhibit 1: The four established innovation budget allocation models
Nagji and Tuff published the 70-20-10 split in Harvard Business Review in 2012. It gives 70% of innovation resources to core innovation initiatives, 20% to adjacent ones, and 10% to transformational ones. The buckets differ in innovation risk and time to return. Splitting along them helps organizations balance risk in innovation portfolio management.
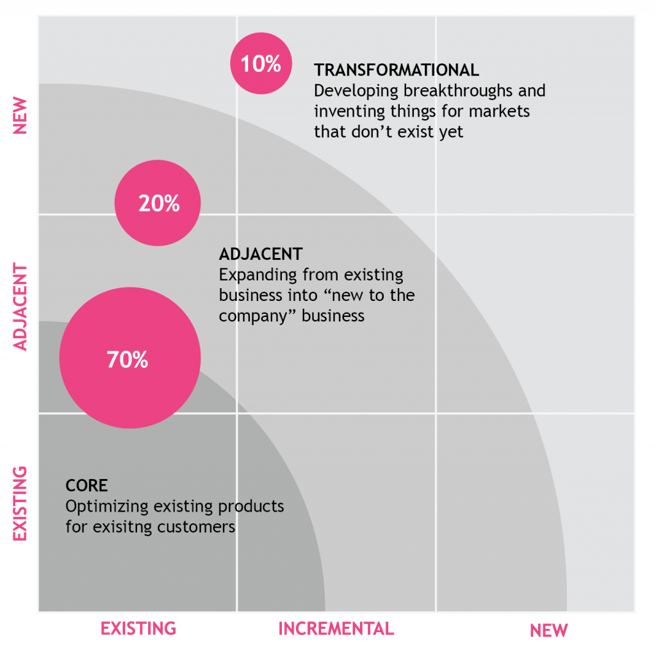
Exhibit 2: The innovation ambition matrix and 70-20-10 rule
The innovation ambition matrix sorts initiatives on two axes: how new the market is, and how new the product or asset is. Those axes turn vague innovation ambitions into budget buckets.
Labels shape governance. In its innovation strategy, one professional services firm from our call data calls the buckets Run, Build, and Explore. Explore gets venture-style gates, while business-led experiments get a lighter process.
The three horizons framework is a time-based form of the same split. McKinsey consultants Mehrdad Baghai, Stephen Coley and David White introduced it in 1999 and sorted innovation activities by time to value. Horizon 1 is today's core business. Horizon 3 holds research projects, pilots, and minority stakes.
Practitioners often attach the 70-20-10 ratio to the three horizons. The time view helps where ambition and timing diverge, as in R&D portfolio management with long development cycles.
Nagji and Tuff studied companies in the industrial, technology and consumer goods sectors. Firms allocating close to 70-20-10 outperformed their peers, typically with a P/E premium of 10% to 20%. A strong innovation portfolio showed up in the valuation.
Returns ran the other way. Core initiatives produced 10% of the long-term cumulative return on innovation investments, adjacent ones 20% and transformational ones 70%.
Long-term financial success therefore sits in the smallest bucket. The returns - but also the chances of failure - are the highest because of uncertainty and risk. Uncertain, new bets crowd out competition, which is why the innovation rent of transformational projects is highest.
Core innovation projects arrive with revenue forecasts. Transformational projects arrive with hypotheses, which lose to forecasts unless their share is protected. Therefore, budgets for transformational projects need to be ringfenced.
Google popularized the ratio in innovation management. Sergey Brin's 2004 Founders' Letter describes a rule he and Larry Page applied to effort. Core search and advertising received 70%. Adjacent areas such as Gmail took 20%; everything else 10%. His reason was diminishing returns on the core.
A year later, Eric Schmidt told Business 2.0 that Google had staff who managed the split, so leaders knew where their time went.
For managing innovation funds, the Nagji and Tuff data is the evidence base.
Nagji and Tuff note that the right balance varies by industry and company. Risk tolerance, growth strategy and strategic objectives decide where your innovation portfolio lands.
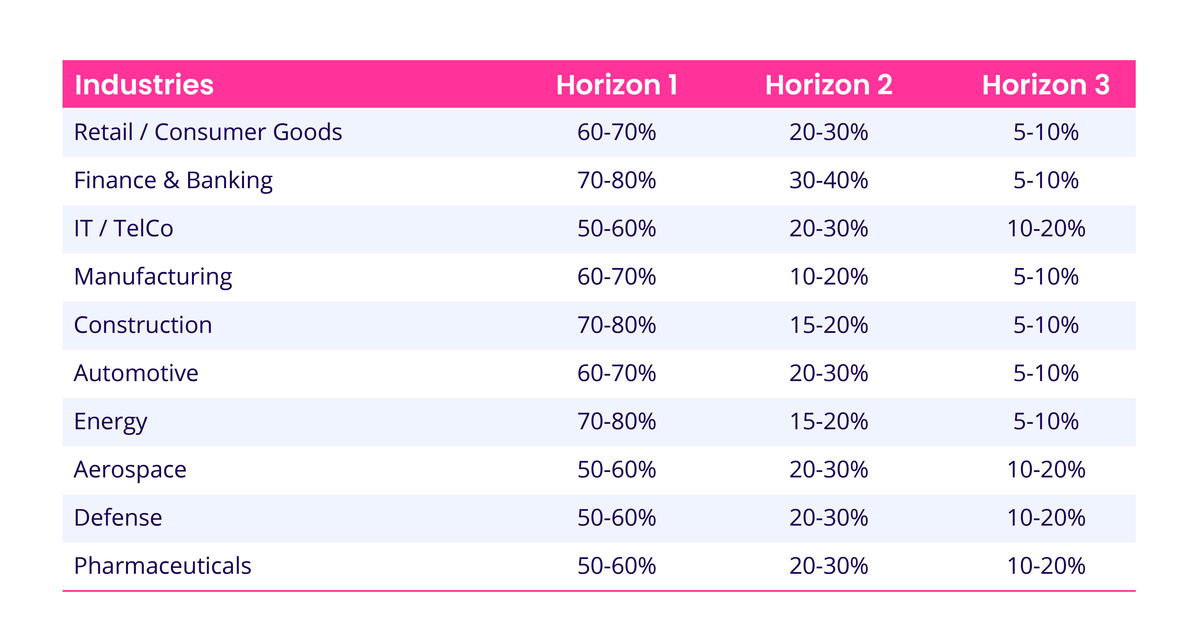
Exhibit 3: Innovation budget spend varies across different industries
Three other models allocate resources by strategic priority, by score, or by evidence instead of by innovation ambitions. They suit the innovation budget decision better when the risk that the core out-resources the rest is lower.
Cooper, Edgett and Kleinschmidt described strategic buckets in 1997 as a top-down link between innovation portfolio management and strategy. Leadership splits the budget into envelopes by market, product line, or project type. Projects compete only inside their envelope.
Resource allocation then mirrors the organization's strategic objectives, and strategic alignment becomes explicit. In 2003, Cooper and Edgett added the advice to ring-fence each envelope. Buckets suit multi-division companies whose units pursue different business objectives.
Scoring models rate innovation projects on weighted criteria such as strategic fit, expected value, and risk. The innovation portfolio board ranks the list and funds from the top until the money runs out.
In a 2001 study of North American firms, Cooper, Edgett and Kleinschmidt found financial methods were the most popular and produced the worst results. Top performers leaned on strategic and scoring methods.
Pure scoring starves the 10%. Transformational projects score low on certainty, so rank them inside their own bucket.
Metered funding treats internal innovation projects like venture investments. Money arrives in phases, and each phase needs evidence against metrics agreed up front. The allocation becomes a ceiling; evidence decides how much of it gets spent.
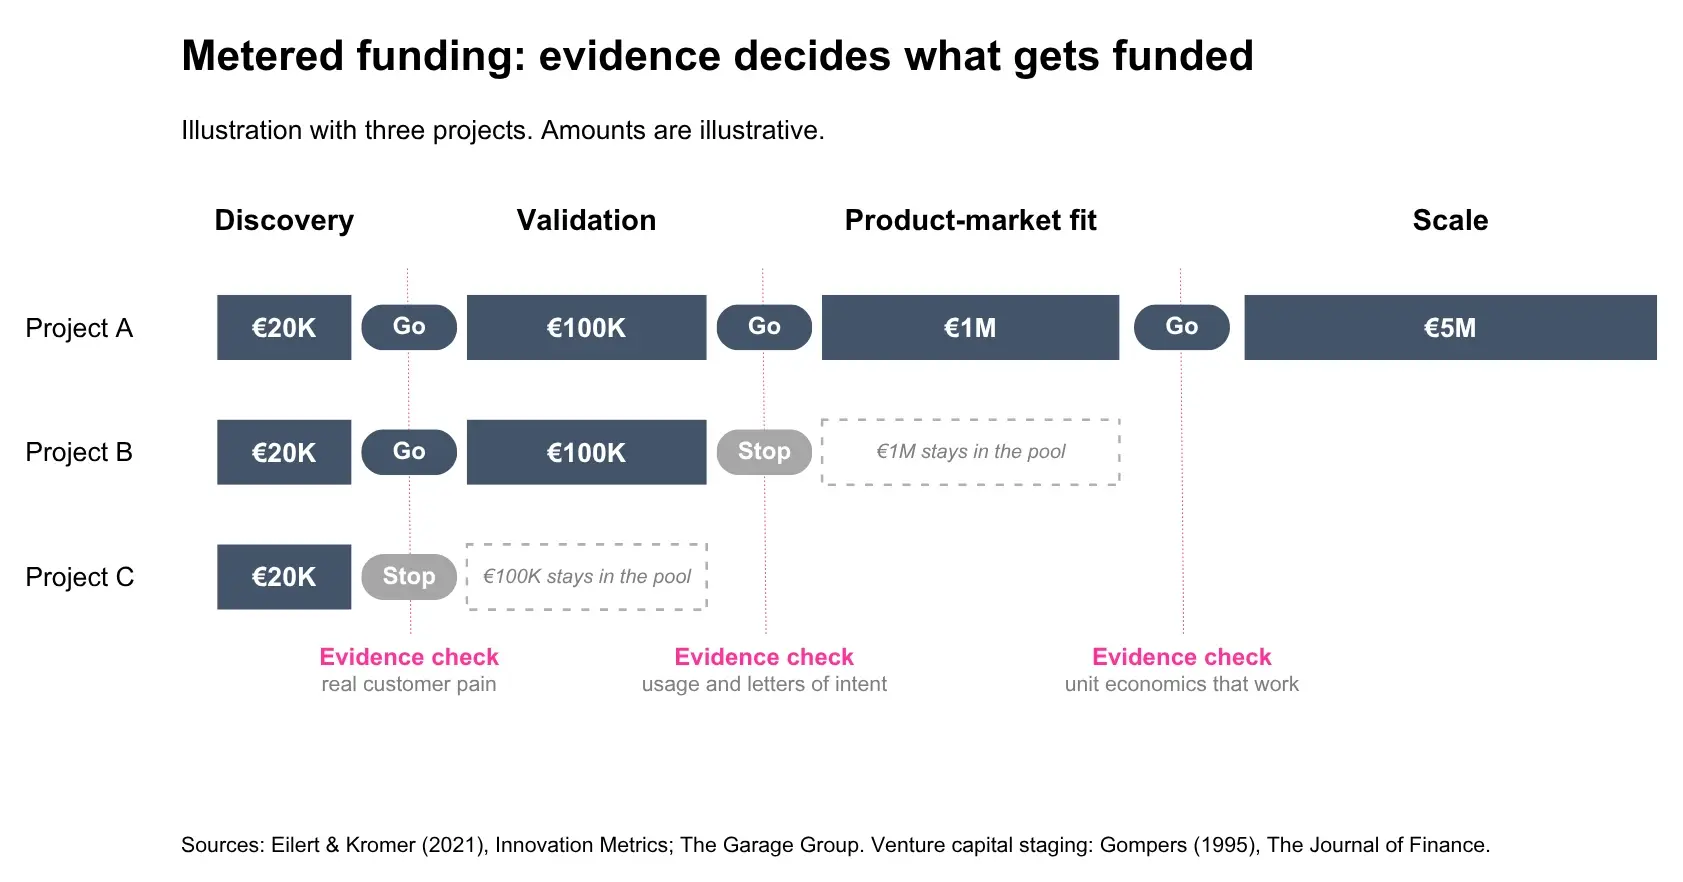 Exhibit 4: Illustrative metered funding process
It fits the transformational bucket, where innovation risk peaks. Early-stage ideas enter the innovation pipeline through small, cheap tests, and teams with a record of successful projects earn the next phase.
Pick the strategic framework by what your innovation portfolio decisions hinge on. Divisions with different mandates call for buckets. A long list of comparable projects favors scoring, and high-uncertainty bets favor metered funding.
The models also stack. Run strategic buckets across business units, 70-20-10 inside each, scores within each share, and metered funding for the riskiest innovation efforts in the 10%. That combination helps you balance risk at every level. As product cycles in your industry shorten, move budget share from the core toward adjacent and transformational work.
A budget allocation becomes real when all innovation initiatives carry a bucket, a budget, and an owner. A spreadsheet covers the first baseline; continuous tracking needs innovation portfolio tools.
Ask two questions of every initiative. Does it serve existing customers or new markets? Does it rely on existing products and assets or new ones? Two "existing" answers make it core, two "new" answers make it transformational, and a mix makes it adjacent.
Then run a strategic fit check. Tag each initiative with the strategic objectives it serves, which makes strategic alignment visible per bucket. Initiatives with zero links to the company's strategic objectives go to the innovation portfolio board for a stop decision.
Publish the criteria before anyone classifies. Innovation managers in every unit can then follow one structured process from intake to the last gate of the innovation process.
Scope the full innovation pipeline: ongoing projects, new projects waiting at a gate, research initiatives, and funded experiments. Owners propose a bucket. A second reviewer from portfolio management checks it against the criteria. Disputes go to the innovation portfolio board, where key stakeholders from finance and the business units make informed decisions.
/Still%20images/Kanban%20Board%20Mockups%202025/Board-L-KPI-aggregation.webp?width=1600&height=1000&name=Board-L-KPI-aggregation.webp) Exhibit 5: A project portfolio board with KPI aggregation inside ITONICS
Exhibit 5: A project portfolio board with KPI aggregation inside ITONICS
The second reviewer matters most at scale. Toyota runs more than 200 R&D projects on one platform. Leave classification to owners at that size, and you get as many interpretations as there are innovation teams.
Count spend, because project counts distort portfolio balance. Ten small transformational pilots can outnumber three large core programs and still cost a fraction of them. The innovation portfolio then looks bolder than its budget.
Put FTE next to budget, since resource allocation covers people as well as money. FTE data turns resource management from estimates into facts. Resource and capacity planning came up in 14.8% of the calls ITONICS analyzed. One company replacing its project management tool called tracking people and money non-negotiable.
The output is one table per business unit with bucket, budget, FTE, and share of total. These key metrics feed innovation portfolio management and informed decision-making at the board.
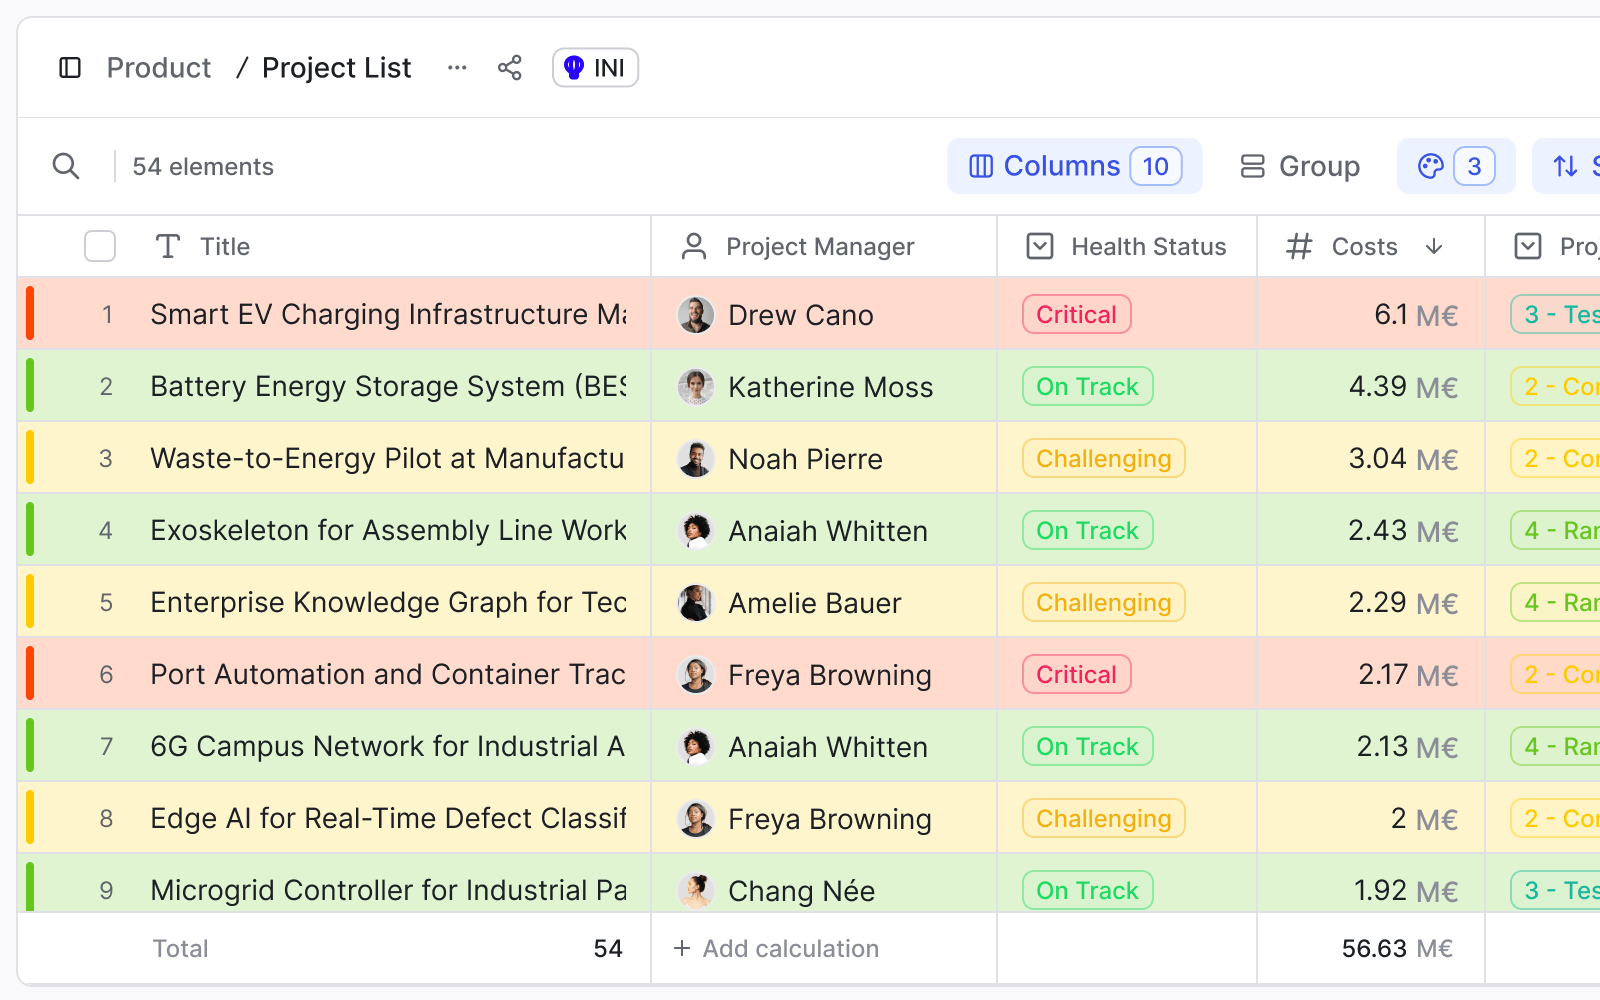 Exhibit 6: Project list with owners, costs, and status inside ITONICS
Compare the real split with the target for each business unit and its strategic objectives. Set a tolerance band of three percentage points per bucket. Inside it, gates run as usual.
Outside the band, freed budget goes to new projects in the under-weighted bucket first. Close gaps at upcoming gates, where innovation projects already face a fund, scale, or stop call.
Every funded initiative carries expected outcomes, written as measurable outcomes for its next gate. The innovation portfolio board can then measure success per bucket and make informed decisions on individual projects with the split in view.
An innovation portfolio split set in the planning round starts drifting at the first gate decision. Four innovation challenges drive the drift in managing innovation funding.
Budget data lives in finance systems. The status of innovation activities lives in slide decks, task tools and inboxes. One professional services firm in our call data stitched its innovation portfolio status together by hand from Planner boards and Teams transcripts.
Goldbeck hit the same wall with startup collaborations. Departments scouted startups in parallel, people spent significant time working out who had talked to whom, and work was duplicated. By implementing ITONICS, they stopped their "watering can" problem.
Move all innovation initiatives into one system of record in innovation portfolio management, with bucket, budget, FTE and gate status. Dräxlmaier took this route for its pre-development workflows and cut manual project reporting effort by 70%.
Each gate decision in the innovation pipeline moves money. Scaling ongoing projects absorbs budget, and stopping an adjacent project frees it.
Labels move as well. Owners pitch their innovation projects toward whichever bucket still has budget, so a core upgrade arrives labeled adjacent.
Make "confirm bucket, budget and FTE" a gate criterion across the entire innovation process, and recalculate the split after every decision. Cooper and Edgett recommend mapping project resource requirements as part of gate deliverables. Innovation strategy and innovation portfolio management then work from the same numbers.
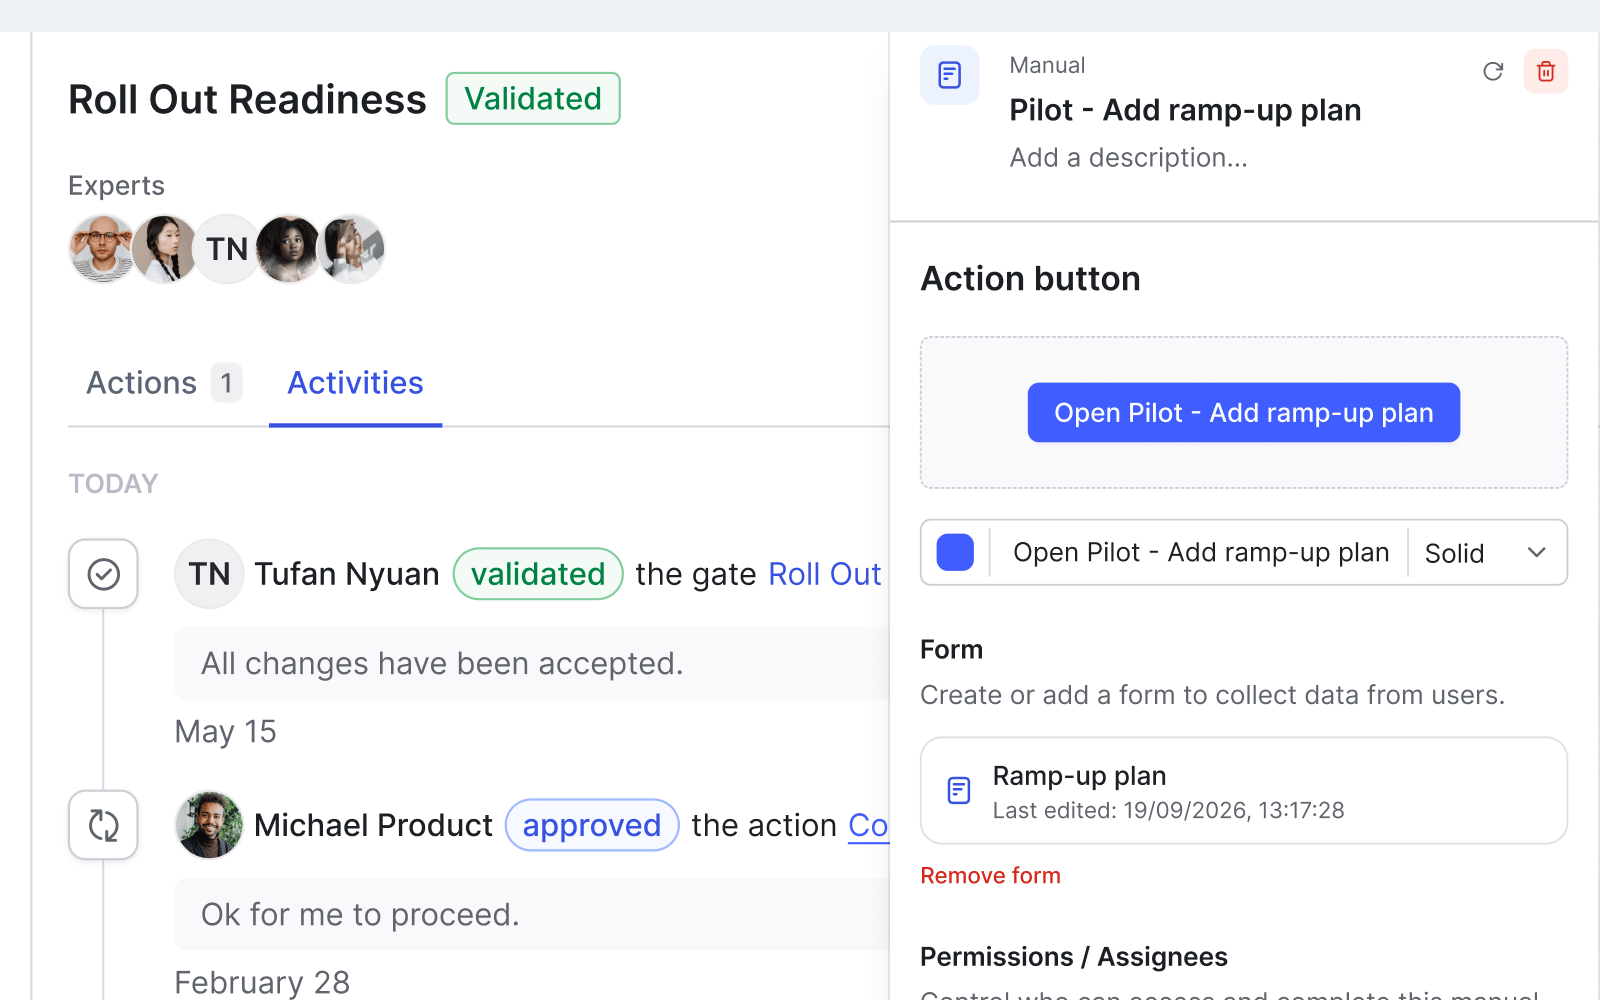
Exhibit 7: A workflow step with assigned owners inside ITONICS
Market trends and emerging trends change a project's value between reviews, and portfolio management review cycles in our call data run slower. One utility's innovation portfolio contributors update their platform twice a year, in a reporting window.
Link signals from the external environment to the innovation projects they affect. Scouts who identify trends early route them to project owners, who trigger an off-cycle review. The board makes informed decisions before the quarter closes.
Cooper and Edgett trace resource shortages in product development to a short-term financial focus and a reluctance to kill projects. Under cost pressure, transformational bets lose budget first because their returns sit furthest out. A specialty materials company in our call data narrowed its strategic buckets during a reorganization and moved toward nearer-term monetization.
The return data points the other way. Core initiatives, mostly incremental innovations, deliver 10% of long-term returns, so cuts there destroy the least future value. Cutting the 10% trades future competitive edge for this year's margin.
Ring-fence the 10% and stop the weakest core innovation projects at their next gate. Cooper and Edgett tie fewer, higher-value projects to maintaining focus across the innovation portfolio.
ITONICS is strategic portfolio intelligence for enterprise R&D and innovation. It suits portfolio managers and innovation teams who need the split to move with every funding decision. Each step above maps to a configurable part of its innovation portfolio management setup.
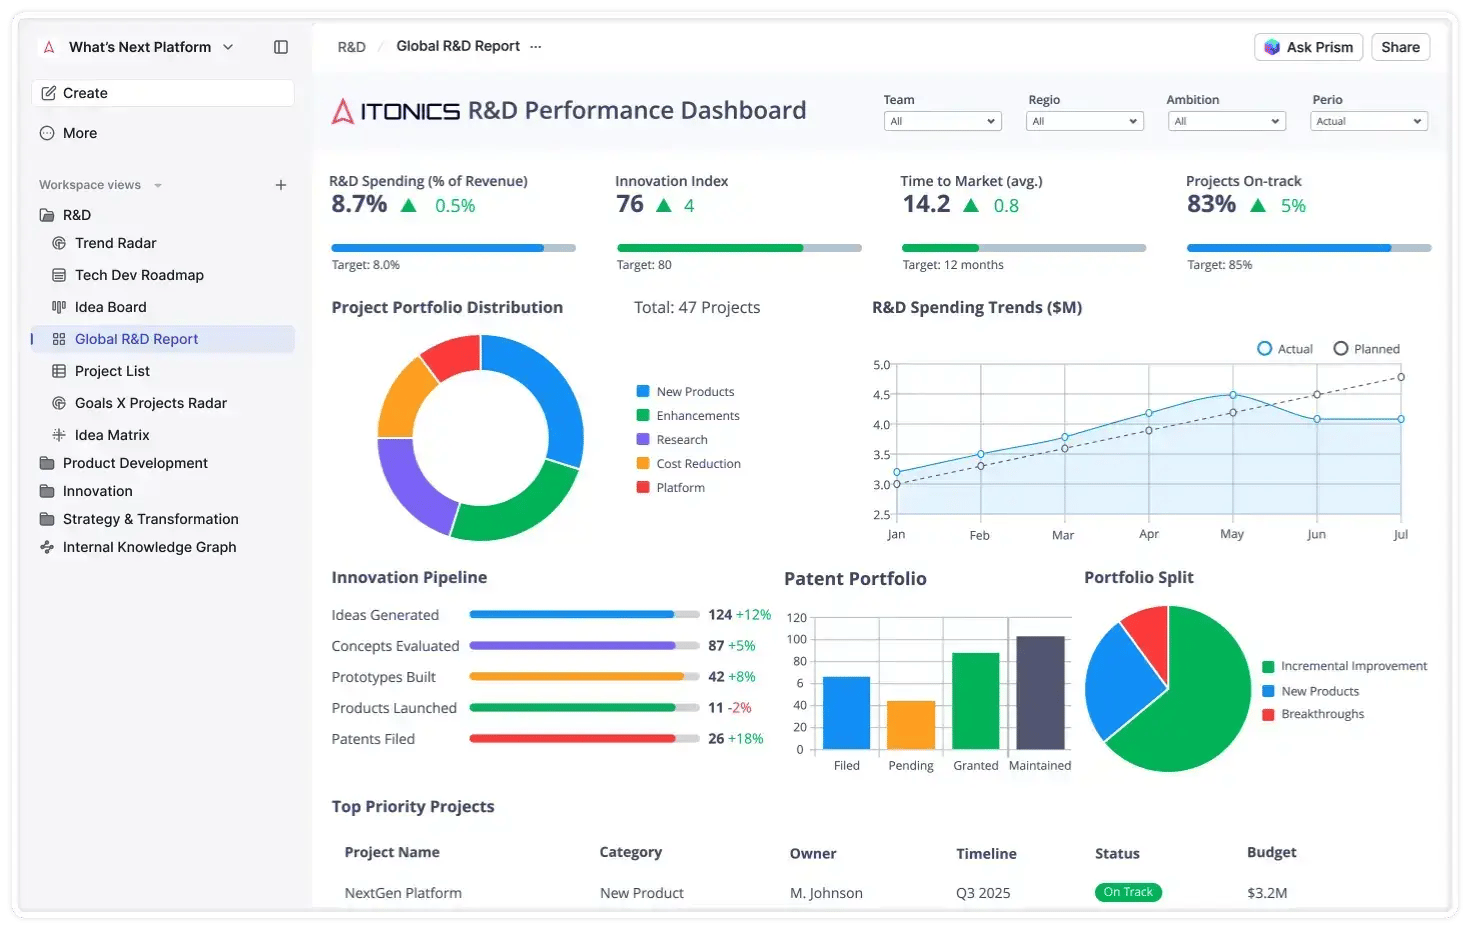 Exhibit 8: R&D performance dashboard inside ITONICS
The split now updates per decision, and the next steering committee sees the real 70-20-10 position of the innovation portfolio. Every number traces back to individual innovation projects. That gives the board a comprehensive understanding of where innovation money goes and which company goals it serves. Decision-making at the gate runs on current data.