Four-fifths of product managers track KPIs without deriving meaningful action. Using vanity metrics, not tying numbers to actions, and waiting too long misses the meaning of key performance indicators: steering product development activities and R&D resources.
Industrial leaders tie product development KPIs to hypotheses. Missed KPI expectations lead to course corrections. When a KPI moves, a decision follows within 48 hours, not at the quarterly review.
Responding more timely requires more than better metrics. It requires a living report-action system. The most effective product management teams operate with a five-step KPI framework.
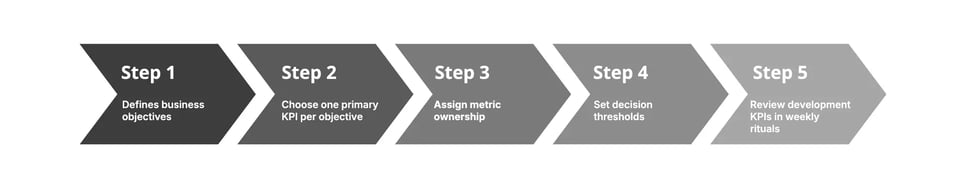
Exhibit 1: The 5-step decision framework for product development KPIs
Each step removes a reason for inaction. Together, they turn a KPI dashboard into a decision engine.
This article breaks down which product development metrics matter at each stage, how to build that framework, and how to apply it across a product portfolio.
Why product development KPIs fail most teams
Teams fail at KPIs before they build a dashboard. The root cause: they measure activity instead of outcomes.
A product development team that tracks "features shipped" knows how busy they are. They don't know whether they're creating value. Activity metrics create the illusion of progress.
Three failure patterns repeat across industries:
#1: Too many metrics, no hierarchy
Scan relevant data and identify weak Signals in real-time. Backed by NLP technology and named entity recognition, teams have instant access to millions of verified sources.
#2: Metrics without owner
A customer satisfaction score with no owner is just a number. Every KPI needs a named person who pulls the lever when it moves. No owner means no action.
#3: Data accuracy without data timeliness
Monthly data for a weekly decision cycle is useless. Industrial product teams invest as much in data availability as in data accuracy. Both matter equally.
The 5-level KPI hierarchy industrial product teams use
Most product development KPI frameworks lump all metrics into one flat list. That makes prioritization impossible. Industrial leaders organize their key performance indicators into five levels (Exhibit 2). Each level answers a distinct question. Each drives a different type of decision.

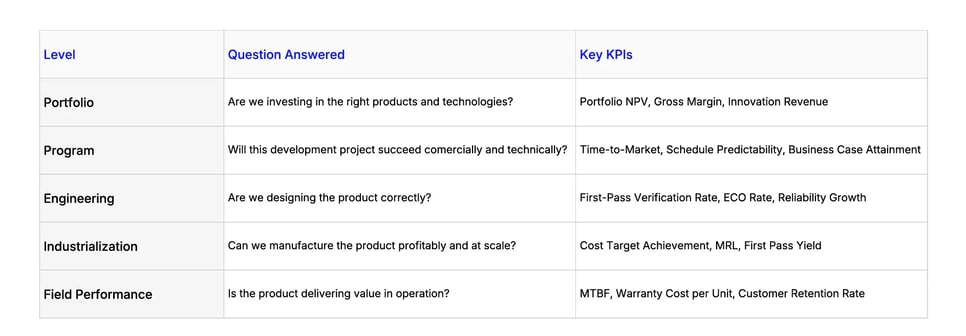
Exhibit 2: The five levels of KPI hierarchy for industrial product leaders
Portfolio level: Are we investing in the right products?
Portfolio-level KPIs answer the capital allocation question. They tell leadership whether the overall investment mix is generating returns and renewing the business.
Portfolio Net Present Value (NPV)
Portfolio Net Present Value (NPV) aggregates the expected financial return of every active development program, discounted to today's value. It answers the investment question directly: which programs earn their cost of capital?
Gross margin per product family
Gross margin per product family reveals which platforms are commercially viable at scale. A gross margin decline of five percentage points across two consecutive quarters signals a cost structure problem, not a sales problem.
Innovation revenue
Innovation revenue — the percentage of total revenue generated by products launched in the last three to five years — measures whether the portfolio is renewing itself. An innovation revenue share below 20% in a fast-moving market is a strategic warning sign.
Customer lifetime value (CLV)
Customer lifetime value (CLV) also belongs at this level. For industrial equipment, CLV includes the initial sale, spare parts, service contracts, and upgrade cycles. A turbine or engine customer with a fifteen-year maintenance relationship generates four to seven times the revenue of the original sale. Portfolio decisions anchored to full CLV consistently produce better long-term returns than decisions based on unit sale margin alone.
Program level: Will this project succeed commercially and technically?
Program-level KPIs track whether individual development projects are on course to deliver their business case.
Time-to-market
Time-to-market measures the elapsed time from validated concept to first customer delivery. For industrial hardware, this typically runs twelve to thirty-six months, depending on complexity. Milestone slippage tracked by the development phase reveals where the process generates the most delay — before it cascades into a full launch postponement.
Schedule predictability
Schedule predictability compares planned versus actual milestone achievement across the development phase. A program that consistently misses internal gates will miss the market window. Track the ratio of on-time gates to total gates per quarter.
Business case attainment
Business case attainment compares actual commercial outcomes - revenue, margin, win rate on competitive tenders - against the projections made at program launch. Programs that consistently underperform their business case indicate either weak upfront assumptions or poor market alignment during development.
Engineering level: Are we designing the product correctly?
Engineering-level KPIs measure design quality and process discipline within the product development team.
First-pass verification rate
First-pass verification rate measures how often a design clears engineering validation tests without requiring rework. A rate below 70% at any verification stage indicates that design entry criteria are not well defined, or that teams are advancing incomplete work to hit schedule.
Engineering change order (ECO) rate
Engineering change order (ECO) rate tracks how many design changes occur after the product moves into build or test phases. Changes made after detailed design are typically ten times more costly than changes made during concept development. High ECO rates erode margin before a product ships.
Reliability growth
Reliability growth tracks whether design iterations are improving predicted MTBF against the specification target over successive test cycles. Flat or declining reliability growth curves late in the development cycle are a significant risk signal that demands intervention before tooling is committed.
Industrialization level: Can we manufacture profitably at scale?
Industrialization KPIs answer whether the product can be built at the cost and quality levels the business case requires.
Cost target achievement
Cost target achievement compares the actual bill-of-materials cost against the cost target set at program launch. A cost overrun of more than 10% at manufacturing release requires either a pricing adjustment or a margin write-down. Both have portfolio consequences.
Manufacturing Readiness Level (MRL)
Manufacturing Readiness Level (MRL) is a structured assessment of how prepared the manufacturing process is to produce the product at volume. Advancing to launch with an MRL below the required threshold is a leading indicator of early field quality problems.
First Pass Yield (FPY)
First Pass Yield (FPY) measures the percentage of units that complete the manufacturing process without defect or rework. FPY below 90% at volume ramp signals a process or design-for-manufacturability problem that will inflate unit costs and delay delivery commitments.
Field performance: Is the product delivering value in operation?
Field performance KPIs are the ground truth of product development. They measure whether the product delivers what was promised in the design specification.
Mean Time Between Failures (MTBF)
Mean Time Between Failures (MTBF) is the primary reliability indicator for industrial hardware in service. A declining MTBF trend across a product generation signals a design or materials problem. Caught in year two of field deployment, a design change is still feasible. Caught in year five, the warranty and reputation damage is already compounding.
Warranty cost per unit
Warranty cost per unit is the financial expression of field quality. Track it per product generation and per component subsystem. A 20% increase in warranty cost between generations — without a corresponding feature increase — demands root cause analysis before the next development phase begins.
Customer retention rate
Customer retention rate closes the loop between field performance and business outcomes. Industrial customers who experience repeated equipment failures switch suppliers at the next replacement cycle. Retention rate is the lagging confirmation that field performance KPIs were either managed or ignored.
Net Promoter Score (NPS) and customer satisfaction score (CSAT)
Net Promoter Score (NPS) and customer satisfaction score (CSAT) complement retention rate at this level. NPS captures whether plant managers and procurement teams would recommend the product. CSAT captures satisfaction at specific touchpoints: commissioning, first service interval, and warranty resolution. Both require structured customer feedback programs — ideally within 90 days of product handover, not annual surveys.
A 5-step framework for product management KPIs that trigger decisions
Most product development departments collect metrics. Few build systems that trigger decisions. Here is how industrial leaders close that gap with a 5-step framework (Exhibit 3).

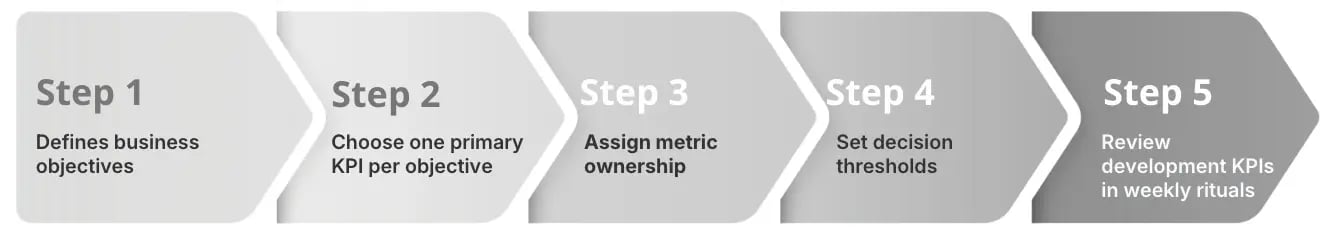
Exhibit 3: The 5-step framework for product management KPIs
#1: Define business objectives first
KPIs exist to measure progress toward specific goals. Without clear strategic objectives, every metric is equally important, which means none of them are.
#2: Choose one primary KPI per objective
Monthly recurring revenue for growth objectives. Customer retention rate for loyalty objectives. Net Promoter Score for satisfaction objectives. One metric per objective prevents confusion.
#3: Assign metric ownership
Each KPI needs one named owner with authority to act. Shared ownership means no ownership.
#4: Set decision thresholds
A target is "achieve 85% retention." A decision threshold is "if retention drops below 80%, initiate a customer feedback campaign within five business days." Thresholds trigger action. Targets measure aspiration.
#5: Product development KPIs in weekly rituals
Product teams that review key metrics weekly identify problems 60 days earlier than teams relying on monthly reporting. Sixty days is often the difference between a fixable issue and a market share loss.
Product management KPIs for portfolio decisions
Individual product metrics tell you whether a product is healthy. Portfolio-level KPIs tell you where to invest next. Product managers steering a portfolio need three lenses.
Market penetration
What percentage of the addressable market does each product serve? Growing penetration signals expansion opportunity. Stalling penetration in a growing market signals competitive weakness.
Revenue contribution mix
What percentage of total revenue comes from each product? A portfolio where one product generates over 70% of revenue is fragile. Revenue diversification is risk management.
Product performance by development phase
Early-stage products need different KPIs than mature ones. Monthly active user growth matters more for new products. Customer retention rate matters more for mature ones. Applying the same KPI framework across a portfolio creates false comparisons.
Industrial product management teams maintain separate scorecards per portfolio stage. Early-stage: user engagement, CAC, market penetration. Growth-stage: MRR growth, NPS, team velocity. Mature-stage: customer retention rate, CLV, and total revenue generated per market.
How ITONICS enables data-driven decisions across the product development team
Most product development departments manage KPIs in spreadsheets or disconnected dashboards. That approach fails at scale. Data lives in silos. Reliable data requires manual aggregation. By the time decision-makers see it, the window to act has closed.
ITONICS gives product management teams a unified platform to connect product roadmap progress to strategic objectives (Exhibit 4). Product managers can link specific development efforts to business outcomes. They can track how each product contributes to total revenue and customer satisfaction at the portfolio level.
/Still%20images/Roadmap%20Mockups%202025/portfolio-visualize-critical-paths-2025.webp)
Exhibit 4: Share interactive roadmaps showing what ships when and what each function needs to deliver
The platform enables real-time visibility into key metrics across multiple products. Product teams can set decision thresholds and monitor product performance against market dynamics without waiting for manual reporting cycles. That moves product management from reactive reporting to proactive steering.
ITONICS also supports cross-functional data management (Exhibit 5). Product development departments can ensure data accuracy by connecting inputs from engineering, sales, and customer success into a single source of truth. That integration makes quantifiable metrics like customer lifetime value, monthly active users, and development efficiency visible to everyone who needs to act on them.

Exhibit 5: Give all functions real-time visibility into feature progress, blockers, and completion status
When product managers can see the full picture across each development phase, they stop tracking projects. They start steering portfolios.
FAQs on product development KPIs
What are the most important product development KPIs for industrial companies?
The five most critical are monthly recurring revenue, customer retention rate, net promoter score, customer acquisition cost, and team velocity. These cover financial health, customer satisfaction, and development efficiency. Start with one primary KPI per business objective before expanding your framework.
How often should managers review development KPIs?
Weekly for operational metrics like team velocity and daily active users. Monthly for strategic metrics like MRR trend and NPS. Quarterly for portfolio-level KPIs like customer lifetime value and total revenue contribution per product line.
What is a good customer retention rate for product teams?
An annual retention rate of 85% or above is a healthy baseline for most product categories. Below 80%, churn becomes structurally damaging to sustainable growth and customer lifetime value.
How do product management KPIs differ from project KPIs?
Project KPIs measure delivery: on-time, on-budget, scope completion.
Product management KPIs measure value: revenue generated, customer satisfaction, market penetration, and user engagement.
Both matter. Only product KPIs steer portfolio strategy.
How do you ensure data accuracy for product development metrics?
Connect data sources directly to your tracking system. Manual reporting introduces lag and errors. Use platforms that pull live data from CRM, analytics, and engineering tools. Treat data availability with the same priority as data accuracy.
What is the relationship between customer lifetime value and product strategy?
CLV tells you which customer segments are worth acquiring and retaining. High-CLV segments deserve product investment. Low-CLV segments require a cost-to-serve review. Product roadmaps tied to CLV segments produce more reliable returns than roadmaps driven by feature requests alone.