Strategic management needs funding follow-through: 7 proof points


Leadership signs off on strategic priorities once a year. Funding decisions happen every week, made by people who were nowhere near that meeting, and nobody catches the drift until it has piled up.
A McKinsey survey of more than 1,200 executives found that fewer than a third said their budgets closely resembled their own strategic plans. Strategy fails in whatever gets funded the following Tuesday, in a decision nobody traces back to the plan meant to govern it. A solid plan on paper means nothing if the funding never follows the underlying business strategy.
The disconnect starts before the budget line. In 86 percent of companies, most employees cannot state the strategy, and only 7 percent of leaders say more than three-quarters of their team's daily work ladders up to it, according to a 2026 benchmark of 180 strategy and operations leaders. Separately, an analysis of more than 20,000 real strategic plans found that only 12.5 percent of strategic projects are ever completed.
This piece covers why that disconnect persists, the seven proof points that confirm it's closed, and how GOLDBECK and DRÄXLMAIER already pass this test. It's written for business leaders and portfolio owners who sit between a strategic plan and the budget meant to fund it, and for the project managers who feel the mismatch first, usually as a funding request that doesn't map to any stated priority.
Follow-through is what turns strategic intent into competitive advantage, instead of leaving it as a slide deck.
Boards approve strategy once a year. Funding decisions happen every week, each one fast: a manager signs off, a budget line moves, work continues.
How quickly an organization closes that mismatch decides who wins, far more than how good the original plan was.
Most enterprise portfolios still run 400 to 500 initiatives through spreadsheets, where volume is the point: dozens of small, fast approvals every week, none large enough alone to trigger a strategic review.
McKinsey puts the gap at roughly 4 percentage points of total shareholder return a year between companies that actively reallocate capital and those that don't, compounding to about double the value over 20 years. Yet a third of companies move only 1 percent of capital annually, even as 83 percent of executives call reallocation the top lever for growth, ahead of M&A.
Bain's 2024 research on more than 400 executives found 88 percent of transformations miss their original ambitions. Most organizations have a follow-through problem more than a strategy problem.
Before a plan reaches a funding decision, it typically passes through some combination of:
PESTLE examines macro-environmental factors, including political and economic trends, that could change a plan's assumptions before it's ever funded.
SWOT analysis identifies an organization's strengths, weaknesses, opportunities, and threats.
Porter's Five Forces assesses industry competition, including rivalry among competitors and the bargaining power of buyers.
The balanced scorecard tracks performance across financial and customer perspectives, alongside internal process and learning and growth.
Dynamic capabilities refer to an organization's ability to adapt to market changes faster than a plan built for a stable one.
A strategy map connects those objectives to the initiatives meant to deliver them.
The diagram below maps how these fit together, alongside two adjacent terms worth a quick gloss. STEEP is a macro-environmental scan similar to PESTLE, covering social, technological, economic, environmental, and political factors. VRIO is a resource test asking whether a capability is valuable, rare, hard to imitate, and organized to capture its value.
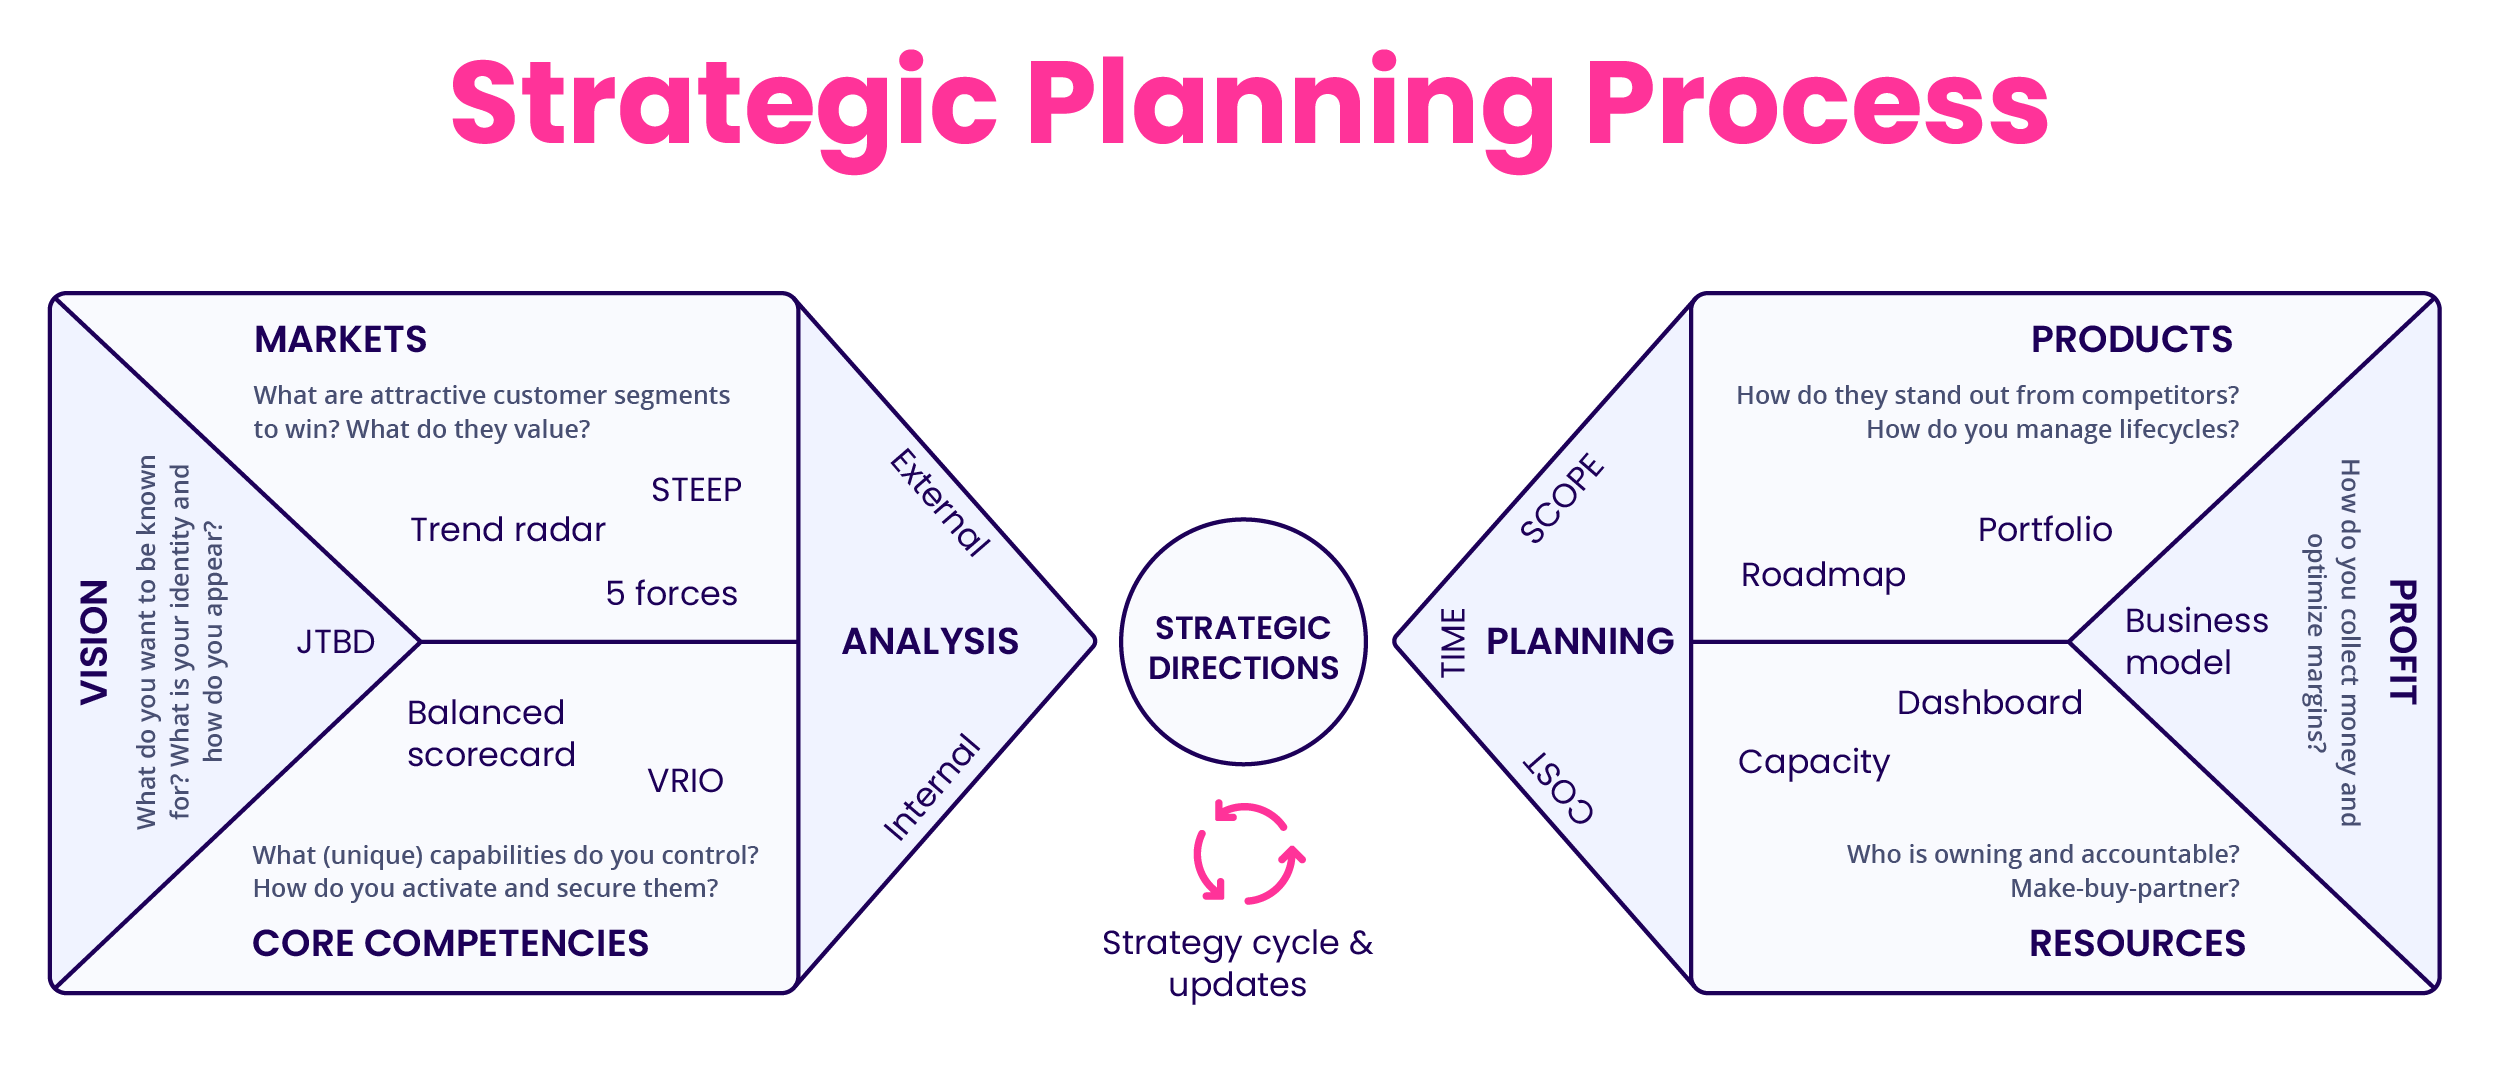
Exhibit 1: A strategic planning process map connecting vision, environmental analysis, and resource planning into one continuous cycle.
The strategic planning guide covers each of these in full.
Strategy formulation, the process of defining an organization's vision and long-range goals, is what produces the plan these tools feed. Vision is a foundational principle of strategic management for a reason: a well-defined vision helps maintain focus on long-term objectives even as funding decisions move week to week underneath it.
None of these tools decide whether funding actually follows the plan they produce. That depends on how fast the organization reallocates once the evidence changes, and whether that speed is disciplined enough to trust.
Two companies can hold equally sound strategic plans and finish the year in very different places, based on how quickly each one moved money, people, and attention, and how well they align resources with the plan, when the evidence changed. That is resource allocation in its rawest form: teams allocate resources and measure progress weekly, tracking it as it happens, whether anyone calls it that or not.
Speed of reallocation is strategy execution: doing the work that used to belong to the plan itself.
That speed difference compounds every cycle, which is why the McKinsey shareholder-return numbers above show up as a durable, multi-year gap rather than a one-time bump.
Decisions move faster than anyone tracks priorities. Inc. magazine asked executives at 600 companies what share of employees could name the company's top three priorities.
The executives guessed 64 percent. Only 2 percent of employees actually could, according to the study cited in Daniel Coyle's The Culture Code.
A weekly funding call can't check itself against a priority nobody in the room can name, so teams keep approving what they've always approved, or whatever they privately guess the new focus is.
Approving funding is fast. Reversing it is slow. Without a trigger agreed before the money moves, pulling funding runs into escalation of commitment, the tendency to keep backing a decision based on what's already been spent rather than what it's likely to deliver.
Count the active initiatives in your portfolio with a documented, pre-approved trigger for pulling funding. A number close to zero means every fast approval this year effectively became permanent, and reversing any one of them will cost more in political capital than approving it ever did.
Slow reallocation and one-directional approvals trace back to one mismatch: strategy updates once a year, funding decisions happen every week, and speed runs in one direction only. Approvals move at the pace of the calendar. Corrections barely move at all.
At the World Economic Forum's Industry Strategy Meeting in March 2026, Tata Steel's Chief Corporate Strategy and Planning Officer, Animesh Sinha, said the "marketplace is becoming structurally more volatile, with cycles turning shorter and sharper." Multiple sessions at the same meeting agreed that scenario planning has to become an ongoing discipline, revisited continuously rather than once a year under pressure.
Strategic planning built for a stable market produces plans that are stale before the first quarter closes, while funding keeps moving weekly underneath it.
Teams that review their goals weekly complete 43 percent more of them than teams reviewing monthly or ad hoc, according to the 2026 OKR Benchmark Report (876 organizations, 20,952 key results). That is the same weekly rhythm a funding trigger needs to hold.
The fix is continuous strategic allocation: a loop that carries market and strategic signals straight through to a named fund, stop, or scale decision, running on the same weekly rhythm as the funding calls themselves. ITONICS's strategic portfolio intelligence guide covers that discipline in full.
A strategy-then-budget-then-execution-then-annual-review model treats strategy management as an annual event, running once a year by design. Software supplies the missing mechanism for running that loop every week instead, and the seven proof points below confirm whether it's actually working.
Every organization can produce a strategy document. Passing the real test means proving something harder: that money actually moves to match it, on a continuous basis.
Seven proof points make that provable. Each is a single, checkable fact about how an organization actually operates, the kind a board member or an auditor could confirm in one conversation. They sit above day-to-day project management: project managers keep a single initiative on track, and these proof points confirm the portfolio is still funding the right ones.
Score all seven true, and funding follows strategy by design. Score even one false, and the disconnect resurfaces somewhere in the portfolio.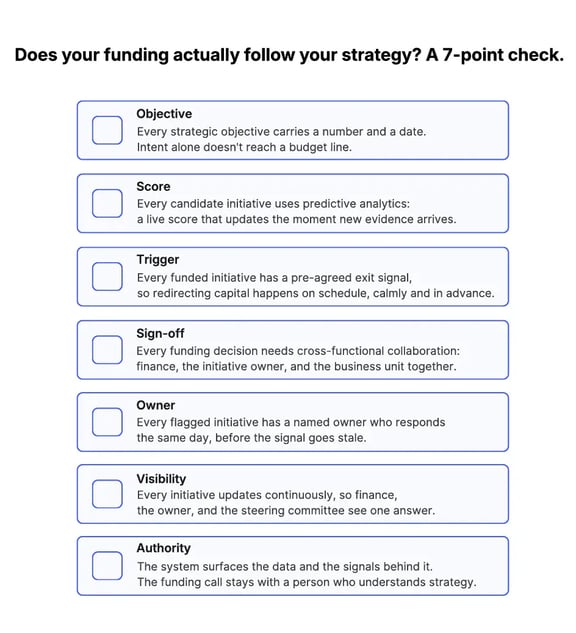
Exhibit 2: Seven checks that reveal whether funding decisions actually follow an organization's stated strategy.
Clear objectives carry a number and a date. Vague ones don't.
Boards test this with one question: what number, by when. A team that answers with a figure and a date has a strategic initiative ready to fund. A team that answers with intent alone still has work to do before that objective reaches a budget line.
OKRs apply this same discipline to goal-setting: measurable targets replace intentions, turning ambitions into measurable outcomes and measurable goals the board can track. The same standard belongs on every objective competing for capital this year, tracked among the key performance indicators the board already reviews as part of routine kpi tracking, rather than filed away in a separate strategic-goals document.
Scope matters as much as clarity. An analysis of more than 20,000 real strategic plans found the ideal portfolio holds 5 to 9 strategic goals; plans that stayed under 20 total elements, goals, measures, projects, and milestones combined, hit a 68 percent high-performer rate, against 22 percent or less for plans that grew past 20.
A quarterly pitch deck describes an initiative once and lets that description stand for months. A live score updates the moment new evidence arrives, a competitor's move, a shift in customer demand, a technology signal, and changes the funding conversation immediately.
Test this by pulling any initiative funded last quarter. If its score matches the number from approval day, the score lives on paper and stops there.
Approving a budget is the easy half of a funding decision. The harder half, naming in advance the exact signal that would justify pulling that budget, gets skipped far more often.
Count the initiatives in your own portfolio with that trigger already written down, whether it lives in a spreadsheet or a configured workflow with approval gates built in. A high count means redirecting capital later becomes a scheduled event instead of a political fight.
A single sponsor can approve a budget quickly and alone, which is exactly why that pattern produces so many stranded initiatives. A cross-functional signature, finance, the initiative owner, and the affected business unit, slows the initial approval by days and speeds every later correction by months. That signature is what turns cross-functional collaboration into a checkpoint every funding decision has to pass, instead of a value the organization only claims to have.
Name the three roles required for sign-off before the next funding cycle opens. A budget with a single name attached carries a single point of failure.
An alert that reaches an inbox and waits for a weekly meeting, buried among upcoming tasks, has already lost its value as a leading indicator. An alert that reaches a named owner with a same-day expectation still functions as one.
Pick any automated flag your system raised this month. A specific person naming their response within 24 hours confirms real ownership. A search through email to find that person confirms ownership in name only.
A quarterly report shows where a portfolio stood weeks ago. A continuously updated view shows where it stands today, letting everyone track progress to the same accuracy for the CFO, the initiative owner, and the steering committee alike.
Ask two stakeholders for the current status of the same initiative right now. Identical answers confirm one live record. Different answers confirm two separate ones, and a reconciliation meeting waiting to happen.
A system can track a thousand signals faster and wider than any team, and still hold zero authority to fund, stop, or scale an initiative. That authority stays with a person who understands the strategy behind the number.
Write down which decisions your system may surface and which stay reserved for a person. A boundary that exists only as a shared assumption gets tested, usually the first time a system's recommendation looks confident enough to skip that person.
Passing all seven at once, for every initiative in a portfolio, exceeds what any team can track by memory or spreadsheet. Software is the mechanism capable of holding all seven true continuously, at the scale a real portfolio requires.

That system has three requirements. A single record holds all seven proof points, replacing the separate trackers most portfolios default to.
The choice of technology becomes a strategic decision in its own right, since the seams between disconnected systems are exactly where funding decisions lose their timing. And a specific set of traits separates a system built for continuous follow-through from a dashboard that only reports on what already happened.
Each proof point above depends on the same underlying fact: the objective, the score, the trigger, the sign-off, the owner, and the monitoring feed all update from a single, shared record.
A team using seven different tools for those seven proof points is really running seven independent forms of manual reconciliation, whether anyone names it that way.
A connected system holds all seven in one place, visible to finance, the initiative owner, and the steering committee at the same time, the key stakeholders who need the same answer without asking twice. Everyone answering the same question about the same initiative gets the same answer, because there's only one place to look, and that single record is what helps ensure alignment holds past the meeting where it got agreed.
A company can staff a strong strategy team, a capable finance function, and a well-run project office, and still carry a structural delay between a market signal appearing and a funding decision responding to it, if those three groups work from separate systems.
Improving each tool separately, a better trend-scouting platform, a better project tracker, a better dashboard, leaves that delay exactly where it started. The delay lives in the seams between systems, and only a connected reporting layer closes those seams. Left alone, that delay is where cost overruns start: a signal arrives, nobody with authority sees it in time, and the budget keeps running on the old assumption.
The same discipline applies to people as much as budgets. 80 percent utilization of resources is a common target across services and technical teams, high enough to avoid idle capacity, low enough to leave room for the reallocation a live signal actually demands.
A connected decision loop has five defining traits, the key components of continuous oversight rather than a periodic check-in.
Connected. External signals, strategic priorities, project portfolios, funding, and execution share the same context.
Continuous. Assumptions get revisited on a rolling basis, independent of the planning calendar.
Evidence-based. Funding shifts as confidence in the evidence shifts.
Explicit. Decision criteria, owners, and reallocation triggers get defined before pressure arrives.
Human-led and AI-enabled. AI expands the speed and scale of analysis, including predictive analytics on where a market or technology signal is heading. A person keeps accountability for the funding call and the decision making that follows it.
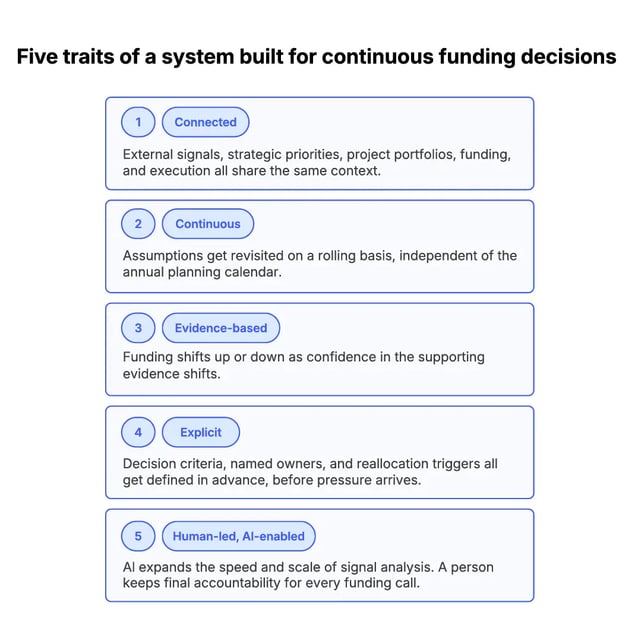
Exhibit 3: Five traits that separate a connected decision system, one built for ongoing funding calls, from a static reporting dashboard.
The seven proof points above sound abstract until they show up in a real portfolio. Two ITONICS customers illustrate them from different angles. One solved a visibility problem, the other solved a reporting problem, and both ended up with the same underlying fix: connect the data first, automate second.
Before centralizing its data, GOLDBECK's Group Innovation team had no way to see which departments had already talked to which startups. The same pitch could get evaluated twice in different departments before anyone noticed the overlap.
Maximiliane Straub, Team Lead for Group Innovation at GOLDBECK, described startups arriving from every direction at once, pitching each department in parallel until people spent real time just figuring out who had already talked to whom.
Bringing scouting, pilots, and vendor conversations into one connected system with ITONICS changed that, giving cross functional teams a single shared record instead of five separate ones. GOLDBECK has since screened over 1,600 startups, tracked 280 use cases across 32 search fields, and trained 166 active scouts, with 240 total users on the platform.
The fix was one shared record of who was already talking to whom, the same mechanism these proof points depend on: one place everyone checks before they act. The full GOLDBECK case study covers how the rollout worked.
DRÄXLMAIER centralized its idea management and pre-development workflows into a single innovation framework with ITONICS. Project metrics, the key metrics for cost savings or sustainability targets, became accessible in interactive dashboards and Kanban boards instead of living in status decks someone had to assemble by hand.
The company reports a 70 percent reduction in manual project reporting effort and hundreds of hours saved annually through automated workflows, freeing each team member on the Innovation Management team to spend that time on the work itself rather than reporting on it, with measurable results showing up in the same dashboards.
That's proof point six in practice. Automated monitoring replaced the calendar-driven scramble to compile a quarterly update. The full DRÄXLMAIER case study covers the rest of the rollout.
/Still%20images/List%20Mockups%202025/portfolio-oversee-tasks-and-assignments-2025.webp?width=1440&height=900&name=portfolio-oversee-tasks-and-assignments-2025.webp)
Exhibit 4: A live portfolio table showing budget consumed, health status, and strategic goal alignment for every initiative in one place.
Neither company started by buying an AI tool. Both connected fragmented data into one system first, then added monitoring and automation on top of a foundation that already worked.
That order matters. Automating a fragmented process just produces bad decisions faster. Connecting the data first is what made both results possible, turning follow-through from an intention into a habit for both organizations.
Both cases point to the same best practices: team leaders got one shared view before they got a smarter one, and the actionable steps that followed, screening a startup, closing a reporting gap, tied straight back to organizational goals instead of a department's own agenda. That is what long-term success in this kind of program actually looks like: unglamorous infrastructure, built first, in service of strategic outcomes rather than isolated activity.
ITONICS holds all seven proof points inside one connected system, so passing this test becomes the organization's default instead of something a few committed people maintain by hand.
The same record carries the objective, the score, and the trigger from the meeting where they were agreed through to the week they need to hold. AI support helps evaluate which initiatives to fund, stop, or scale, but the funding call stays with the cross-functional group from proof point four, weighing the available resources on hand.
/Still%20images/Roadmap%20Mockups%202025/portfolio-visualize-critical-paths-2025.webp?width=1440&height=900&name=portfolio-visualize-critical-paths-2025.webp)
Exhibit 5: Roadmap with projects and milestones showing schedule conflicts
That gives every stakeholder, finance, the initiative owner, the steering committee, the same view of the portfolio that GOLDBECK and DRÄXLMAIER described above, a clear roadmap from signal to informed decision instead of the spreadsheet reconciliation that used to eat hours every month.
The real competitive advantage is the ability to reallocate faster than competitors, and that speed only becomes real once it has a system to run in. A plan that never reaches the budget stays an intention, however sound the strategic vision behind it or how clearly it captures the organization's purpose.
ITONICS is what turns that intention into a system: less annual ritual, more weekly follow-through, success measured in decisions made. See the strategy execution approach, or explore the full method in the strategic portfolio management guide.