Seventy-three percent of innovation initiatives fail to meet their ROI targets. Yet most organizations continue making portfolio decisions the same way they did a decade ago: gut feel dressed up with PowerPoint slides.
The gap between available data and actual decision-making has never been wider. Innovation teams have access to more market intelligence than ever: patent databases, competitive intelligence, technology trends, and customer insights. But this abundance creates a new problem: analysis paralysis. Teams drown in data while starving for actionable insights.

Exhibit 1: The data-driven innovation approach
The companies winning at innovation aren't collecting more data. They're processing it faster, analyzing it smarter, and translating insights into decisions at speed. The difference? A 40% efficiency gain that frees analysts from operational tasks and redirects capacity toward strategic thinking.
Why most companies fail at innovation intelligence
Fortune 500 teams process 500+ market signals weekly. Technology trends, competitive moves, regulatory changes, customer needs. The data never stops.
Yet most innovation intelligence efforts fail.
The typical scenario: Three analysts burn 60 hours per week collecting data from various sources, manually categorizing information in spreadsheets, preparing quarterly reports that arrive too late to influence strategic decision making.
They spend 80% of their time on collection and organization. Just 20% on actual analysis.
By the time insights reach decision-makers, competitive opportunities have passed. Strategic approaches have shifted. The intelligence is stale.
This creates a vicious cycle. Low confidence in market analysis leads to ignored recommendations. Reduced investment in business intelligence capabilities. Further degraded decision quality.
The result? Innovation projects are selected on politics rather than evidence. Late-stage pivots that waste millions. Portfolio risk is undetected until failures occur.
Where data-driven innovation adds +40% efficiency gains
Data-driven innovation breaks this cycle through three compounding factors, significantly enhancing operational efficiency and driving innovation.
Automated signal collection eliminates 75% of manual scouting time. Instead of analysts searching news sites, patent databases, and other sources individually, automated feeds powered by AI algorithms and machine learning models continuously process vast data sets. Teams review pre-filtered signals rather than hunting for them, reducing human errors and increasing speed.
/Still%20images/Element%20Mockups%202025/foresight-stay-in-the-loop-2025.webp?width=2160&height=1350&name=foresight-stay-in-the-loop-2025.webp)
Exhibit 2: ITONICS alert on interest increase for emerging trend
Weekly collection time: 20 hours → 3 hours per analyst.
Structured analysis frameworks cut evaluation time in half. Pre-built templates for technology screening, portfolio assessment, and opportunity evaluation replace ad-hoc approaches. Analysts apply consistent criteria (market potential, technical feasibility, strategic fit, resource requirements, and potential for new products), ensuring accuracy and reducing costs.
Analysis time: 6 hours → 2.5 hours per evaluation.
Centralized intelligence platforms eliminate 30-40% of duplicate work. When R&D, strategy, and product teams maintain separate systems, organizations waste effort on redundant market analysis. A single source of truth with role-based views lets teams contribute once and consume intelligence relevant to their needs, enhancing collaboration and operational efficiency.
The compound effect: Process 10x more signals. Spend 40% less time on operational efficiency tasks. Free capacity for strategic analysis that drives better portfolio decisions and supports strategic decision-making.
How to make evidence-based decisions in innovation
Efficiency without better decisions is meaningless. The goal isn't to analyze faster; it's to decide with confidence and execute with conviction.
Most innovation decisions fail because they're made on incomplete evidence. A promising technology assessment without market validation. Strong customer demand without feasibility analysis. Strategic alignment without resource reality checks.
Evidence-based decision-making requires three distinct types of proof working together. Miss one, and confidence collapses. Get all three, and success rates jump from 55% to 75-85%.
The three evidence types that build decision confidence
High-confidence innovation decisions require three distinct evidence types.
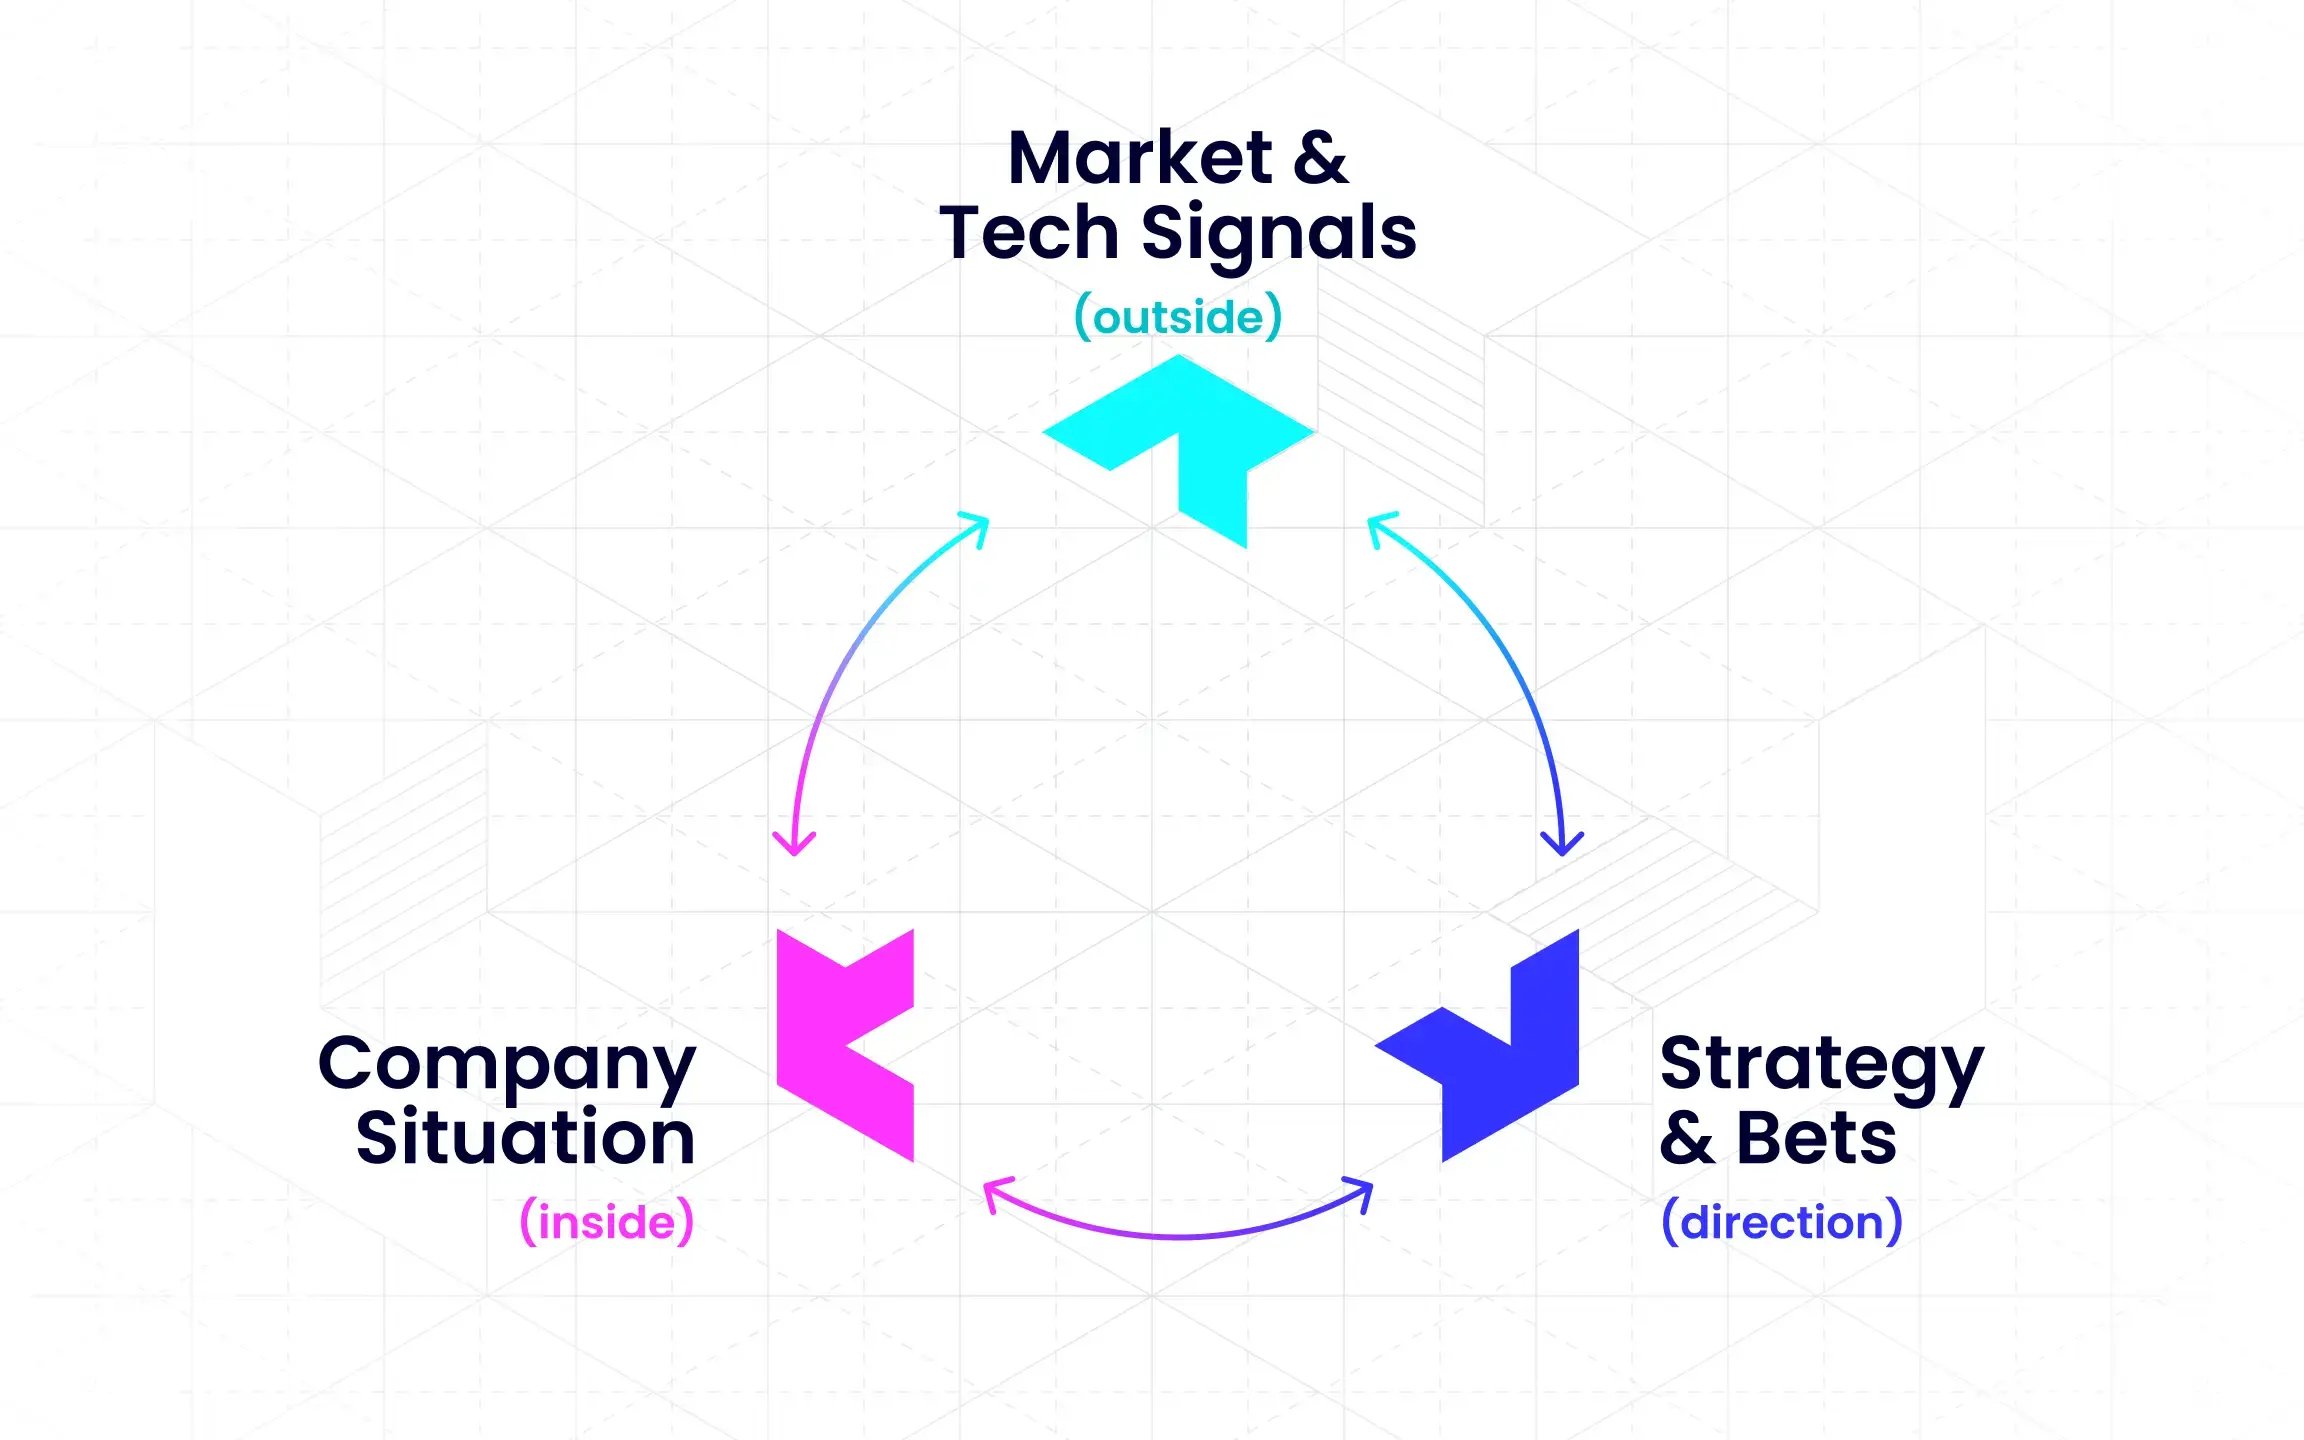
Exhibit 3: The three pillars of evidence
External market intelligence: Technology maturity indicators, competitive positioning, customer demand signals, and regulatory trends from various sources validate market opportunity and timing through industry analytics, patent analysis, trend monitoring, and competitive intelligence.
Internal performance data: Historical success patterns, resource capabilities, execution track records, portfolio balance metrics validate feasibility and organizational fit through project retrospectives, success rate analytics, team capacity models, and financial performance data, helping reduce risks of human errors.
Strategic alignment scoring: Mapping against multi-year roadmaps, contribution to strategic goals, and portfolio balance across innovation horizons validate strategic value and ensure new initiatives strengthen rather than fragment focus.
Decision confidence correlates with evidence coverage. High-confidence decisions (75-85% success rates) combine strong evidence across all three types. Medium-confidence (55-65% success) has gaps in one area. Low-confidence (<50% success) relies on assumptions in two or more categories.
The 70% confidence threshold
Innovation decisions rarely offer 100% certainty. Yet teams delay action waiting for perfect information.
The optimal decision point: 70-80% confidence. High enough to justify commitment. Fast enough to capture opportunities and maintain a competitive edge.
Calculate confidence by scoring each evidence type 1-10, then apply weights: external intelligence (40%), internal data (40%), strategic alignment (20%). A score of 7.0 = 70% confidence.
Below 50%? Delay decisions or run small pilots to gather data.
Between 50-70%? Proceed if decisions are reversible and commitments modest (<€100K).
Above 80%? Check for confirmation bias. Excessive confidence often signals ignored contradictory evidence.
The practical rule: If gathering additional evidence takes more than two weeks and won't change the decision, commit now with monitoring triggers.
Time spent moving from 70% to 90% confidence rarely improves outcomes but frequently means missed opportunities.
Why evidence-based decisions require continuous validation
Evidence-based decision making isn't one-time. Market conditions shift. Technologies mature faster or slower than predicted. Competitive dynamics evolve.
Decisions made with 75% confidence today can drop to 40% in six months if assumptions prove incorrect.
Maintain quality through structured validation. Document key assumptions: "Technology X reaches commercial viability within 18 months." "Customer segment Y will pay a premium for feature Z."
Set review triggers. Metrics indicating failing assumptions: customer interest scores below 6/10, competitive alternatives with 30% cost advantage. Schedule formal reviews quarterly for strategic initiatives, monthly for fast-moving technologies.
This creates organizational learning. After 20-30 decisions, patterns emerge. Which evidence types predict success most accurately? Which assumptions fail most frequently? Where do teams consistently over- or underestimate difficulty?
Teams tracking decision outcomes improve forecast accuracy from 55-60% to 75-85% within 18 months.
Data-driven innovation across the innovation journey
Automated environmental scanning
Traditional environmental scanning breaks at scale. Manual monitoring of dozens of sources, individual relevance assessment, and compiled reports. This can't process 500 weekly signals.

Exhibit 4: Auto-detected interest increase on the trend eco-friendly packaging
Automated intelligence gathering solves the volume problem using AI algorithms and machine learning models to analyze big data from various sources.
Configure feeds from technology databases, industry publications, patent offices, startup trackers, and regulatory sources. Apply AI innovation-powered models to score relevance based on innovation focus areas, competitive landscape, and strategic priorities.
Analysts receive 50-75 high-relevance items weekly, not 500 unfiltered sources.
The multiplier: Monitor 10x more information sources. Spend 75% less time on collection. An analyst who spent 20 hours weekly searching now spends 3 hours reviewing curated signals.
Seventeen hours freed for deeper market analysis and strategic synthesis. The role shifts from information gatherer to insight generator, leveraging artificial intelligence to enhance efficiency and reduce human errors.
Evidence-based idea selection
Ad-hoc opportunity evaluation wastes time and produces inconsistent results. One analyst emphasizes technical feasibility. Another prioritizes market size. A third focuses on strategic fit.
Comparing opportunities becomes impossible.
Structured evaluation templates standardize the process. Define 5-7 core criteria: market potential (addressable market, growth rate), technical feasibility (complexity, IP landscape), strategic alignment (roadmap fit, competitive advantage), execution risk (team capability, dependencies), financial attractiveness (ROI, payback period).
Score each criterion 1-10 with clear definitions. 3 = "significant challenges." 7 = "favorable conditions." 10 = "exceptional opportunity."
Teams using standardized frameworks reduce evaluation time from 6 hours to 2-3 hours per opportunity. Improved comparability across opportunities accelerates decision-making and drives innovation.
/Still%20images/Kanban%20Board%20Mockups%202025/ideation-organize-idea-flows-2025.webp?width=2160&height=1350&name=ideation-organize-idea-flows-2025.webp)
Exhibit 5: A portfolio of ideas with one idea marked as priority very high
The structured approach reveals patterns. If 80% of opportunities score 8+ on market potential but 4- on technical feasibility, the idea portfolio is too ambitious given current capabilities.
Faster portfolio risk detection
Portfolio risk hides in lagging indicators. Budget overruns appear after money is spent. Schedule delays surface after deadlines pass. Market misalignment becomes obvious after launch.
By the time problems reach leadership, correction options are limited and expensive.
Automated monitoring transforms risk management from reactive to proactive. Track leading indicators: declining customer validation scores, competitive product launches in target segments, regulatory changes affecting feasibility, team turnover on critical projects, and scope changes exceeding thresholds.
Set automated alerts when indicators cross warning levels. Customer interest is below 7/10. More than two key team members are leaving. Competitive alternatives announced within 90 days of planned launch.
Organizations using predictive analytics detect problems 6 weeks earlier than manual portfolio reviews, enabling faster responses and reducing costs.
Time for course correction: reallocate resources, adjust scope, accelerate timelines, make kill decisions before sunk costs multiply. Early detection converts potential failures into learning opportunities rather than expensive mistakes.

Exhibit 6: ITONICS Prism flags off-strategy projects
Cross-functional intelligence sharing
Large organizations routinely duplicate market analysis. R&D assesses technology trends in semiconductor manufacturing. Strategy evaluates the same trends for portfolio planning. Product teams analyze them for roadmap decisions.
Each function maintains separate systems, producing independent reports and slightly different conclusions.
Confusion and wasted effort.
Centralized intelligence repositories with role-based access eliminate redundancy. R&D contributes to technology assessments with technical analysis. Strategy adds market sizing and competitive positioning. Product teams incorporate customer data and willingness to pay.
Each function sees the complete picture while filtering for specific requirements.
The efficiency gain compounds. Eliminating duplicate work saves 30% of analysis time. Shared intelligence produces better decisions.
/Still%20images/Radar%20Mockups%202025/capability-views-ease-multi-criteria-decisions-2025.webp?width=2160&height=1350&name=capability-views-ease-multi-criteria-decisions-2025.webp)
Exhibit 7: ITONICS trend radar, highlighting the trend Convergence of AI
When strategy sees R&D's technical feasibility concerns and R&D understands strategy's market timing pressures, cross-functional alignment improves. Organizations report 40% fewer conflicts over portfolio priorities after implementing shared intelligence systems, driving operational efficiency and fostering a new era of collaborative innovation.
Building your data-driven intelligence stack
Collection layer: Where signals come from
The collection layer automates signal gathering using advanced AI technologies and machine learning algorithms to process vast data sets from multiple sources.
-
Technology feeds: Patent databases (USPTO, EPO), research publications (arXiv, IEEE), startup trackers (Crunchbase, PitchBook).
-
Market intelligence: Industry analysts (Gartner, Forrester), regulatory bodies (FDA, EMA), news aggregators, and specialized trade publications.
-
Competitive monitoring: Automated alerts track product launches, funding rounds, partnerships, and leadership changes.
-
Internal sources: CRM systems, project databases, and research repositories provide valuable customer data and operational insights.
The key to success is automated relevance scoring powered by AI models trained on strategic priorities, reducing 500 weekly signals to 50-75 high-priority, actionable items. This approach enhances efficiency, reduces human errors, and provides a competitive edge by enabling faster response to market trends and growth opportunities.
Analysis layer: Structuring and evaluating insights
The analysis layer leverages AI tools and systems to structure evaluation and support strategic decision-making.
Purpose-built innovation platforms offer configurable workflows for technology screening, portfolio reviews, and opportunity assessment. Taxonomy management ensures consistent categorization across data sets, while collaborative features enable cross-functional input from users across the organization. Visualization capabilities transform complex data into clear, actionable strategic insights.
Critical requirements include workflow automation that routes analyses through review stages, seamless integration with collection and distribution layers to avoid manual data transfers, and flexible reporting tailored to diverse stakeholder needs. These AI-driven processes enhance productivity, reduce costs, and improve the accuracy of innovation intelligence.
/Still%20images/Workflow%20Builder%20Mockups%202025/portfolio-use-approval-workflows-2025.webp?width=2160&height=1350&name=portfolio-use-approval-workflows-2025.webp)
Exhibit 8: Configurable workflows ensuring seamless data handling
Distribution layer: Delivering insights to decision-makers
The distribution layer ensures the timely delivery of insights using AI-powered dashboards and automated reporting.
Interactive dashboards provide real-time views of technology radars showing maturity versus strategic relevance, pipeline funnels displaying conversion rates, and resource heatmaps indicating initiative allocation. Automated reports generate executive summaries on demand, while mobile access ensures leadership stays informed regardless of location.
Integration with existing collaboration tools such as Teams, Slack, Jira, and PowerPoint meets users where they work, facilitating faster, evidence-based decisions that drive innovation and operational efficiency.
Integration layer: Connecting with other tools
Integrated platforms covering all layers reduce implementation time from six months to six weeks by eliminating data transfer errors and version control issues.
This investment delivers sustained efficiency gains of 40-50% in ongoing analysis time while expanding coverage and improving decision quality. By leveraging AI systems and data-driven innovation frameworks, organizations can enhance their ability to explore new opportunities, accelerate innovation, and maintain a competitive edge in a rapidly evolving world.
Build your innovation intelligence stack today with ITONICS, the leading innovation platform
The ITONICS Innovation Management Platform offers a single point of truth for collecting, organizing, analyzing, and managing data.
/Still%20images/AI%20Mockups%202025/capabilities-collaboration-one-single-source-of-truth.webp?width=2160&height=1350&name=capabilities-collaboration-one-single-source-of-truth.webp)
Exhibit 9: One single platform for handling all innovation activities
Eliminate information silos: Dispersed teams and disconnected data often result in missed opportunities and duplicated efforts. With ITONICS, all your new products, most innovative ideas, and market insights are centralized in one place. Create transparency and reduce inefficiencies by keeping everyone on the same page.
Streamline idea and feedback collection: Managing a high volume of ideas from various sources can be overwhelming. ITONICS allows you to capture, evaluate, and prioritize ideas from across the organization, including customers and partners, all in one structured process. This helps focus resources on the most impactful ideas and reduces time wasted on less promising ones.
Track innovation progress across teams: Monitoring the progress of multiple innovation projects across departments isn’t easy. ITONICS provides visual dashboards and roadmapping that give you a real-time overview of ongoing projects, ensuring you can quickly address roadblocks, identify risks, and keep everything on track.