R&D scenario modeling: Fund the roadmap the market and capacity backs


Toyota Motor Europe manages 200 initiatives on one platform, worth more than 20 million EUR. Every large R&D organization eventually arrives at a version of that number. Two hundred initiatives. Finite engineers. One budget cycle. How do you plan the right sequence?
Robust R&D scenario modeling changes what a scenario contains. A scenario becomes a candidate version of your roadmap. Named initiatives. Costed. Staffed with the specialists you actually employ. You then test each candidate against the two variables that move fastest between budget cycles: market and technology signals, and capacity in the skills you are short of.
That produces something a product team can carry into a steering committee. Fund this. Stop that. Scale the third.
/Still%20images/Roadmap%20Mockups%202025/portfolio-simulate-roadmap-scenarios-2025.webp?width=1440&height=900&name=portfolio-simulate-roadmap-scenarios-2025.webp)
Exhibit 1: Creating roadmap scenarios inside ITONICS
This article focuses on the key components: what robust scenario modeling protects, the two inputs it needs, the four steps to run it, and how it works on a portfolio of 200 projects.
Scenario modeling pays for itself when the product roadmap changes. Use that as the test. Did your last three strategic planning cycles produce any reallocation of resources? If not, your strategic planning is not optimal. Neither new product goals nor crucial market changes were considered as input factors.
Think of this cascade:
Without scenario modelling, the best roadmap will always result from a blindsided view. In the worst case, the roadmap planning only considers possible states of the future, new feature ideas, or available resources.
Robust scenario modeling develops the big picture. This big picture creates three key benefits:
Robust R&D scenario modeling is the practice of building several candidate versions of an R&D roadmap and testing each roadmap against two moving constraints: dated evidence that the market and technology signals still support its bets, and capacity in the scarce skills that gate delivery.
Roadmap scenario modelling is a named, costed configuration of initiatives. The output is a fund, stop, or scale decision on specific projects.
Trouble in R&D portfolios is quiet. Projects hit key milestones. Collaboration works across development teams. Dashboards track progress in green. Spend lands inside financial planning tolerances. The initiative executes correctly against a business case nobody retested.
Delivery health and strategic health are separate questions. Most stage gate reviews in organizations only ask the first. Scenario modeling asks the second, on a schedule, against evidence, and connects both to the strategic goals the business is funding.
/Still%20images/Kanban%20Board%20Mockups%202025/capabilities-views-configure-cards-and-views.webp?width=1440&height=900&name=capabilities-views-configure-cards-and-views.webp)
Exhibit 2: A project board across three innovation horizons and RAG categories
Battery chemistry, model architectures, and materials science do not wait for the December budget round.
ITONICS analyzed 2,193 customer and prospect conversations:
Portfolio and prioritization came up in 68.2% of them.
Resource and capacity planning in 14.8%.
Excel appeared as the incumbent tool in 19.8%.
A spreadsheet re-scored once a year is a weak instrument for steering a strategic portfolio of 200 projects and 20 million EUR. Resource allocation decisions of that size need a live process.
Two established practices carry the name scenario modeling. Both stop one step short of a funding decision.
Foresight scenario planning builds future environments. Two critical uncertainties, four quadrants, four worlds. The output is a set of narratives about the economic and technological context. Shell built the method for that purpose, and it remains the right tool for testing whether a strategy survives a shock.
Financial planning tools model the same organization in currency. Base case, best case, worst case. Revenue, headcount, capital expenditure. The output tells you what the numbers do under different assumptions.
Both create useful data. Neither produces a decision about a named project, because neither holds the roadmap as its unit of analysis. Roadmap planning is where strategy meets resource allocation, and that is where scenario modeling has to operate.
A roadmap scenario does. It is one specific configuration of initiatives, with owners, budgets, sequencing, and key milestones. Comparing two roadmap scenarios means comparing two versions of what your development efforts will be next year.
|
Foresight scenario planning |
Financial planning scenarios |
R&D roadmap |
|
|---|---|---|---|
|
Unit of analysis |
Future environments |
Budget line items |
Named initiatives on a portfolio roadmap |
|
Key variables |
Critical uncertainties |
Revenue, cost, headcount |
Signal momentum, scarce capacity |
|
Output |
Narratives and implications |
Best case and worst case numbers |
Fund, stop, and scale decisions |
|
Horizon |
5 to 15 years |
1 to 3 years |
12 to 36 months |
|
Owner |
Strategy or foresight |
Finance |
R&D portfolio management |
|
Question answered |
What could the world look like |
What happens to the numbers |
Which roadmap do we fund |
Exhibit 3: Comparing foresight, business case and roadmap scenarios
Keep them. Run them once a year to set the boundary conditions your product roadmap has to survive. They are the right structured approach for a ten-year technology roadmap in a regulated industry, and they force teams to name the economic and regulatory factors that could break the strategy.
Foresight scenarios stop at implications. An implication has no owner, no budget line, and no date. Nobody has ever defended a stop decision to a steering committee by citing a quadrant.
Each candidate roadmap states its own trade. It names which initiatives get funded, which get stopped, which get scaled, and which specialists move where. Stakeholders can argue with a trade. They cannot argue with a narrative, which is why narratives leave meetings unchanged, and roadmaps stay frozen.
That is the difference in decision-making. A foresight scenario changes how a strategy team thinks. A roadmap scenario changes where the money goes.
Only two variables move fast enough to change a funding decision between planning cycles. Focus on those two and skip the rest.
Every project was approved because someone believed something about the market. A technology would mature. A regulation would land. A segment would grow. That belief moved the plan.
The evidence score asks one question: is that belief still true, and is the world moving toward it or away from it? Score it 1 to 5.
|
Score |
What it means |
|---|---|
|
5 |
Signal accelerating. Fresh evidence from the last 6 months. The case is stronger than at approval. |
|
4 |
Signal holding, evidence current. Nothing has moved against it. |
|
3 |
Signal flat, or the last real evidence is 6 to 12 months old. |
|
2 |
Signal decaying, or the evidence is over 12 months old. |
|
1 |
The belief has been falsified. A competitor shipped it, or the standard went elsewhere. |
Exhibit 4: Signal evidence scoring framework
Two rules make this work.
Age caps the score. With no evidence from the last 12 months, a project cannot score above 3, whatever the room believes. Confidence without a date is memory. Historical data tells you where the signal was. The data tells you whether the likelihood is still there.
Score the belief, not the project. Twenty projects usually rest on six or seven underlying market conditions. Score each belief once. Every project resting on it inherits that number. This cuts the work by two-thirds.
/Still%20images/Element%20Mockups%202025/portfolio-receive-risk-alerts-2025.webp?width=1440&height=900&name=portfolio-receive-risk-alerts-2025.webp)
Exhibit 5: ITONICS alert showing an increase in interest increase in the trend rise of autonomous networks
Most capacity models total FTEs and divide. That arithmetic hides the constraint.
You may have 240 R&D engineers. You have four who can do high-voltage battery management, and three of your strategic initiatives need them in the same quarter. In aggregate, capacity looks comfortable. In the skills that gate delivery, it is oversubscribed by 180%.
Model capacity this way:
An initiative running 20% over on a scarce skill does not announce it. It absorbs the overrun and pushes key deliverables. Scope creep in R&D usually starts as a staffing assumption nobody checked.
Resist adding a third input. Strategic fit scores, business goals, and product strategy alignment correlate with each other and with internal politics. Two variables that move, scored consistently across every project, beat nine factors that sit still.
Keep the focus narrow. A model with two inputs gets run. A model with nine inputs gets rebuilt every year and never reaches a steering committee.
Expert judgment belongs in the room where candidate roadmaps get compared. It does not belong inside the score.
Sequence matters. Data first, candidates second, scoring third. Product managers that build candidate roadmaps before pulling the data produce roadmaps they had already decided on.
The process below runs on any portfolio, in any of the various industries where R&D budgets outlast the evidence that justified them.
One view of every active initiative. Owner, stage, spend to date, remaining budget, milestones, primary goal, customer needs. Then the two scores from the previous section: evidence 1 to 5, capacity flag red, amber, or green.
Expect to find 10% to 20% more running initiatives than the official count, and some with no owner. Log both and keep moving. Teams that stop to perfect the data never reach step 2.
The step ends with a diagnosis, not the roadmap. Plot everything against the two scores:
|
Capacity holds (green) |
Capacity oversubscribed (amber/red) |
|
|---|---|---|
|
Evidence 4 to 5 |
Fund and scale |
Rescope or hire against the gap |
|
Evidence 1 to 2 |
Reallocate the capacity |
Stop |
Exhibit 6: Decision-making framework based on roadmap scenario modeling
Evidence 3 is the waiting room. No move until someone refreshes the score.
The bottom row is the reallocation pool: the money and specialists already inside your portfolio that current evidence no longer supports.
On a 200-project portfolio, expect 25 to 40 initiatives there, typically 8% to 15% of the budget. The most expensive corner is bottom-left. Low evidence, capacity green, every dashboard showing on time. Nothing in a stage gate review will ever flag it.
Everything the steering committee is about to decide is in that pool. Step 1 makes it visible.
Three roadmap scenarios are typically created. Each roadmap version answers one question differently: where does the reallocation pool go?
Do not add a mixed candidate, because it gets buy-in by default and stops nothing. Do not add a cost optimization candidate because it changes the budget conditions and hands the decision to finance. If finance prioritizes initiatives, re-run all three at the lower budget and show what overall business objectives will be at risk.
/Still%20images/Roadmap%20Mockups%202025/portfolio-visualize-critical-paths-2025.webp?width=1440&height=900&name=portfolio-visualize-critical-paths-2025.webp)
Exhibit 7: Roadmap with projects and milestones showing schedule conflicts
The steering committee compares three roadmap versions. At best, this is not a static document but an agile calculation where initiatives can be easily moved and agile roadmap scenarios form. The steering committee approves one candidate as the new baseline.
The approval is not a vote on a direction. Because each candidate was built from named initiatives, approving it is the project decision list: these 14 stop, these 9 scale, these specialists move here, effective this quarter, signed by these people.
Amendments are normal and usually improve the strategic planning. Two rules keep them from unwinding the work. They stay inside the budget, and any project added back carries a stop of equal capacity. Amendments pay for themselves, or the room has rebuilt the mixed option by accident.
Every stop gets an owner, a date, and a redeployment plan for the freed specialists. A kill without a redeployment plan leaks people to other business units within a quarter.
The approved candidate becomes the new frozen baseline. Triggers keep it honest:
One person owns the watch. A system can assist. A fired trigger means re-scoring the affected initiatives and re-testing the candidates they touch.

Toyota Motor Europe centralized 200 initiatives worth more than 20 million EUR on one platform, alongside trends, technologies, competitors, and new proposals from its European product teams. A portfolio at that scale runs the first full cycle in about eight weeks, later cycles in two.
The steps do not change with size. The tooling requirement does. At 20 projects, a spreadsheet carries the model. At 200, each step makes a demand the spreadsheet cannot meet.
Consolidating 200 records takes a third of the first cycle. The data lives across Excel files, SharePoint folders, and three project managers' inboxes, and no software collapses it for you. Same record structure for every item: same fields, same stage definitions, same budget periods.
Scoring stays manageable because 200 projects rest on 15 to 25 underlying market beliefs. But scoring by belief only works if the system links each signal to the initiatives resting on it. Trend record and project record in the same database, connected, evidence date visible on both.
A visual map of the external landscape does the calibration. When the room sees every tracked technology and trend at once, with movement and maturity encoded, the 1-to-5 score stops being an opinion and becomes a reading.
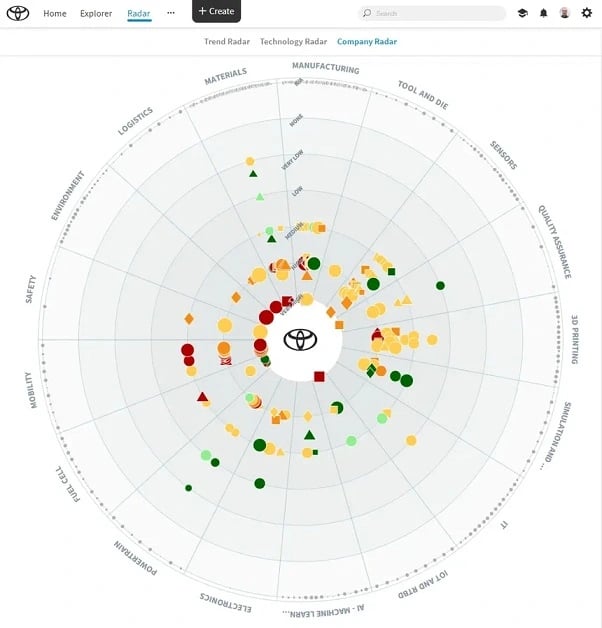
Exhibit 8: Toyota company radar powered by ITONICS
One condition makes roadmap-building fast: roadmap scenarios are saved views of one dataset, not three separate files. Copy-pasting 200 rows into three spreadsheets creates three versions of the truth that diverge by Thursday.
With one dataset, a status change in one roadmap updates that candidate's capacity sums, budget totals, and skill flags on the spot. Filter to the reallocation pool, plot any two properties, move initiatives between candidates while the aggregates recalculate.
At this scale, Defend typically funds 120 to 140 initiatives fully instead of 200 partially. Bold bet moves 15 to 25 projects worth of capacity into accelerating work.
Resistance concentrates in the middle of the portfolio. Nobody defends the obviously dead work. The fight is over projects with real progress and thin evidence, and that fight is the value of the exercise.
Present and discuss each roadmap. Strategic portfolio intelligence system like ITONICS Prism helps you show the trade, the stops, what it frees, which signals justify each move, and what it risks.
The approved moves then execute where they were modeled. Stopped projects change status in front of everyone. Freed specialists get reassigned on the roadmap, milestones and owners carried over. A decision re-keyed into a second tool decays on the way.
Manual signal-watching fails silently at this size. Nobody re-reads 25 trend records every month.
The system has to scout continuously, flag momentum shifts against the signals your initiatives rest on, and answer the portfolio question directly: given what moved, what stops, what scales, what starts. Expect three to six triggers per quarter.
Scoring everything. Teams rate 200 projects across nine criteria, stall in step 1, and the model never ships. Two variables, shipped, beats nine criteria, abandoned. Add sophistication in cycle three, once the process has produced a stop that held.
The second mistake costs more. Scenario modeling without the mandate to stop anything is a very rigorous report. Get that authority in writing from the executive sponsor before step 1, including who signs a kill.
ITONICS is the strategic portfolio intelligence platform that runs this model end to end. Three capabilities carry it.
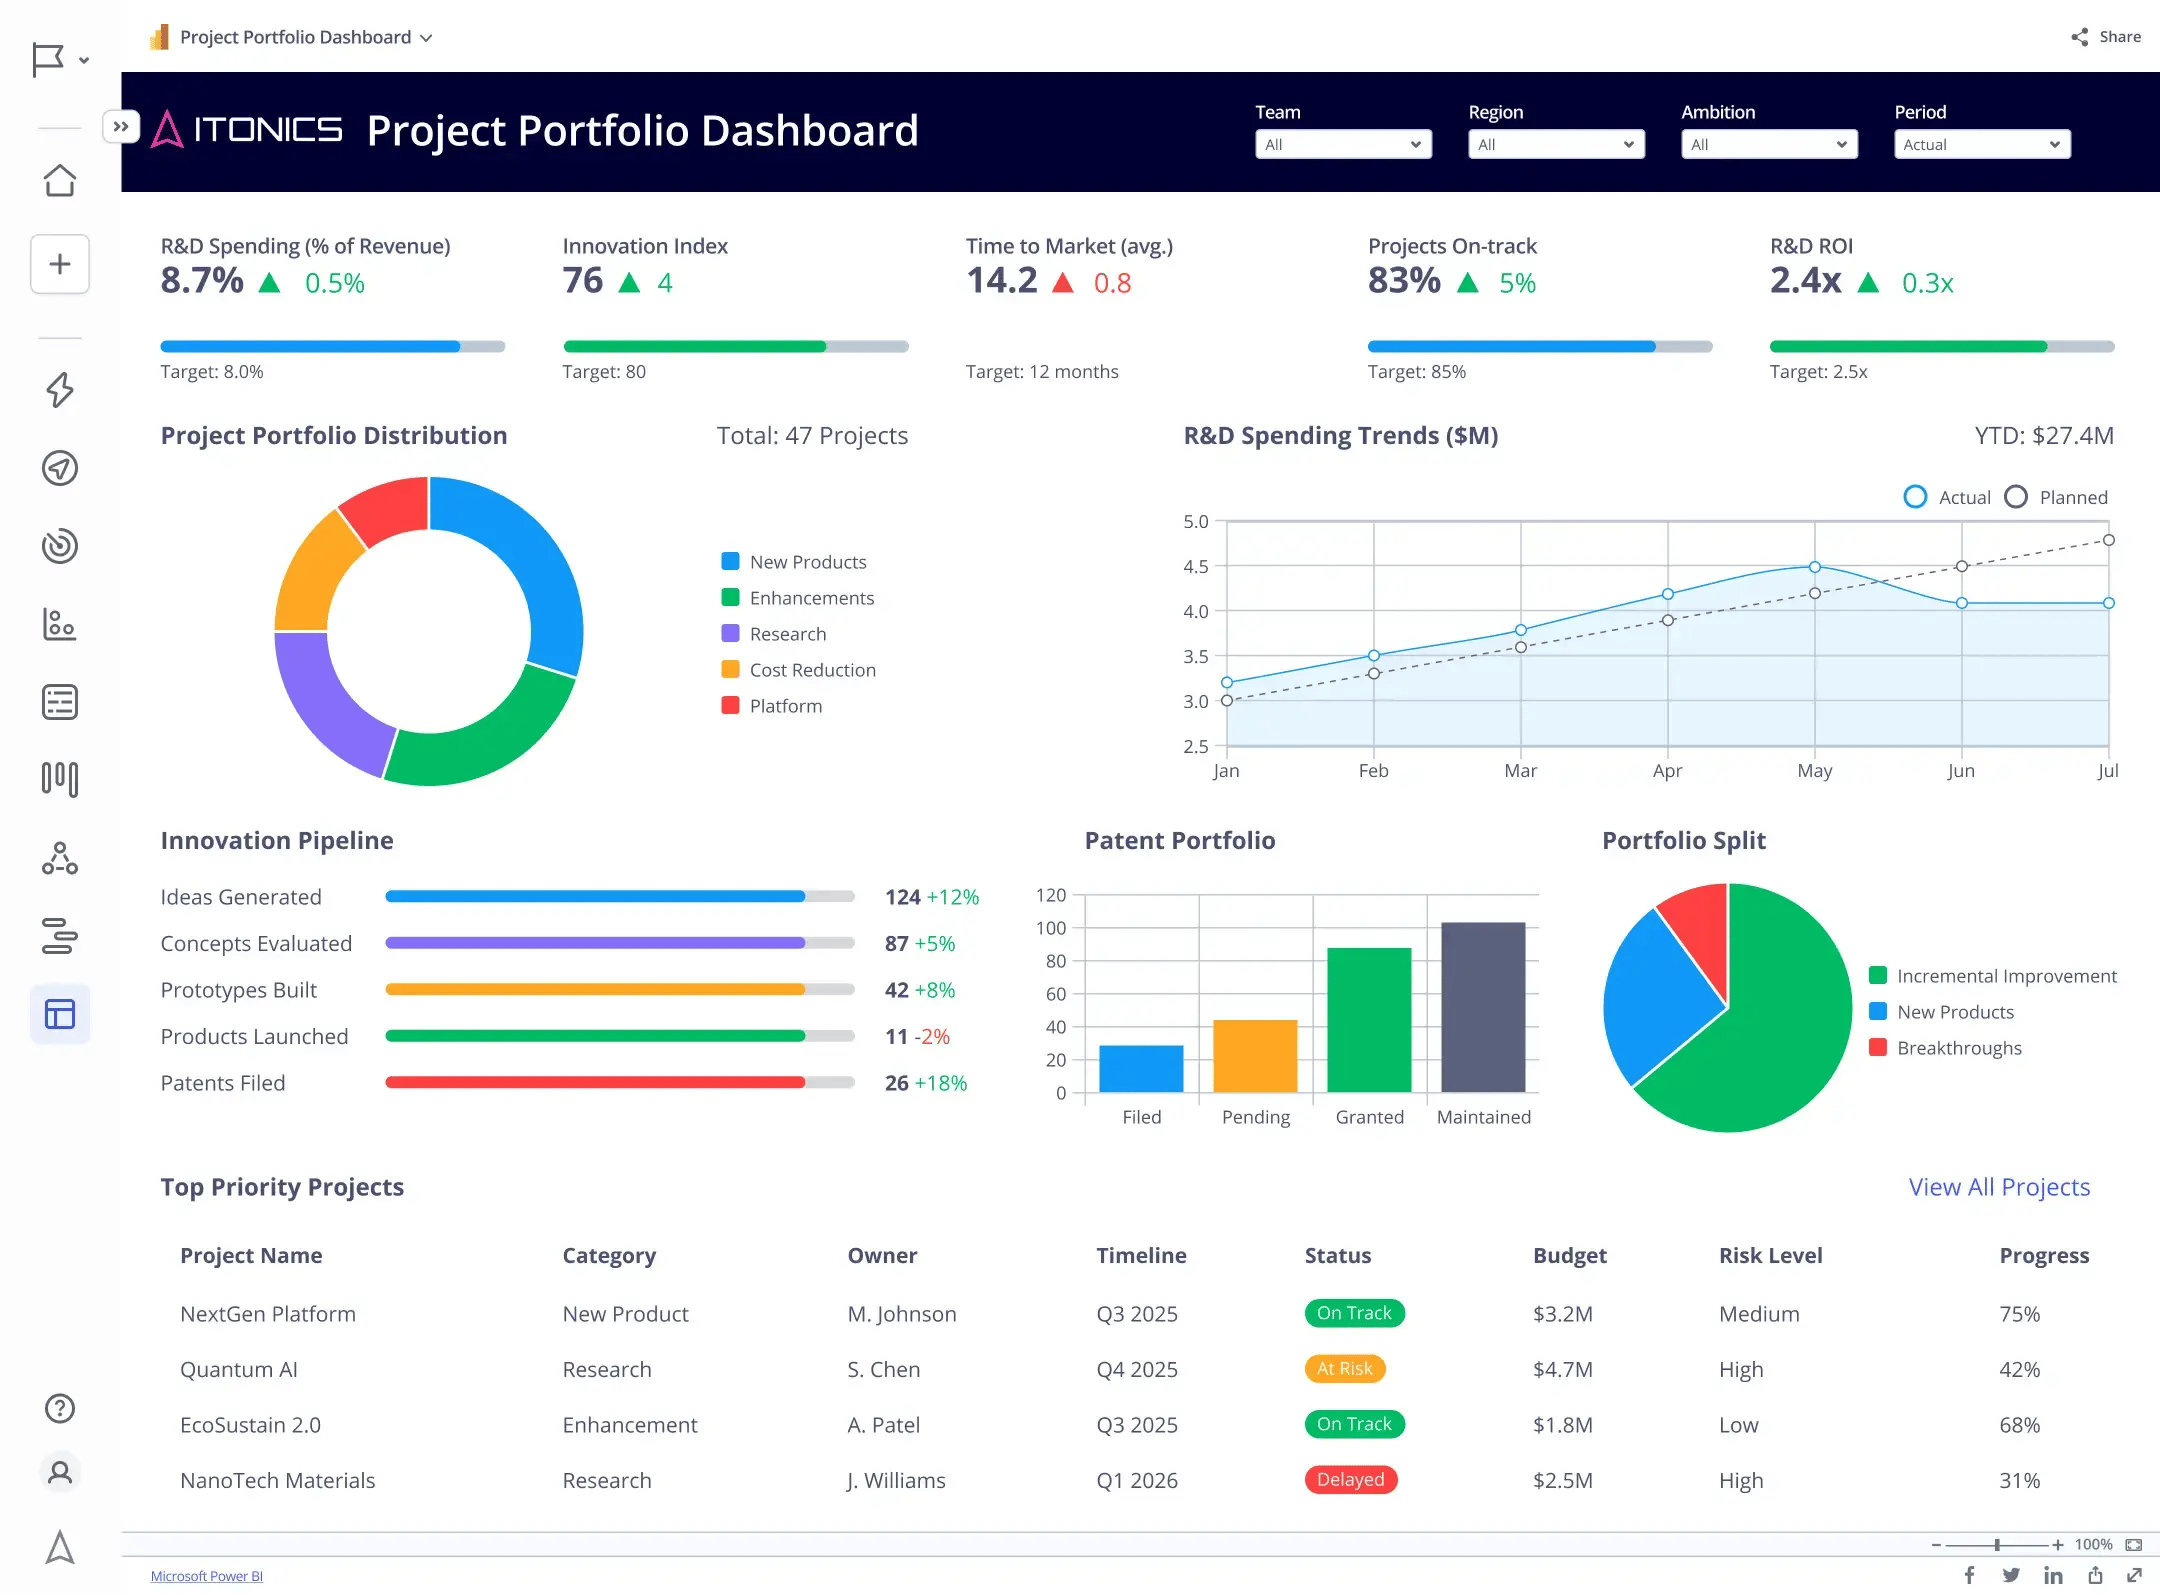
Exhibit 9: Project portfolio dashboard with live KPI data inside ITONICS
External signal scouting. The radar continuously maps trends, technologies, startups, and competitors, drawing on a curated data lake of 50 million signals. Each signal links to the initiatives resting on it, with the evidence date visible. Your 1-to-5 scores stay a reading of the landscape instead of a memory of it.
Roadmap creation and versioning. Candidate roadmaps are saved views of one dataset. Build Baseline, Defend, and Bold bet in days, move initiatives between them, and watch budget and capacity totals update live. Version control keeps three candidates from becoming three truths, and roadmaps provide the execution path once the committee decides: owners, milestones, and stops carry straight over.
Prism, the intelligence layer connecting both. The platform's context-aware AI reviews signals against the portfolio and answers the question the model exists for: what to stop, what to scale, what to start.