How a trend radar provides the foresight to fund the right projects


Most foresight work stops short of creating links between insights and business decisions. A trend report captures a moment and ages on the shelf until the next one arrives. A trend database is a searchable pile of signals, comprehensive and flat, with every entry weighted the same. Both formats describe the landscape, but fail to inform roadmap decisions.
A trend radar is built to provide a balanced and comprehensive perspective. It ranks trends by urgency and impact, shows how each one moves over time, and gives every stakeholder one shared picture to work from. That living, spatial view answers the question reports and databases leave open: which trends deserve a project, a budget, and an owner right now.
A trend radar disconnected from projects, budgets, and owners stays a research artifact. This article shows how to build a trend radar that changes decisions. It covers why trend radars fail, a five-step process to build one that drives action, and how foresight and innovation teams at SwissPass, Würth, and Cisco wire trends into their portfolio.
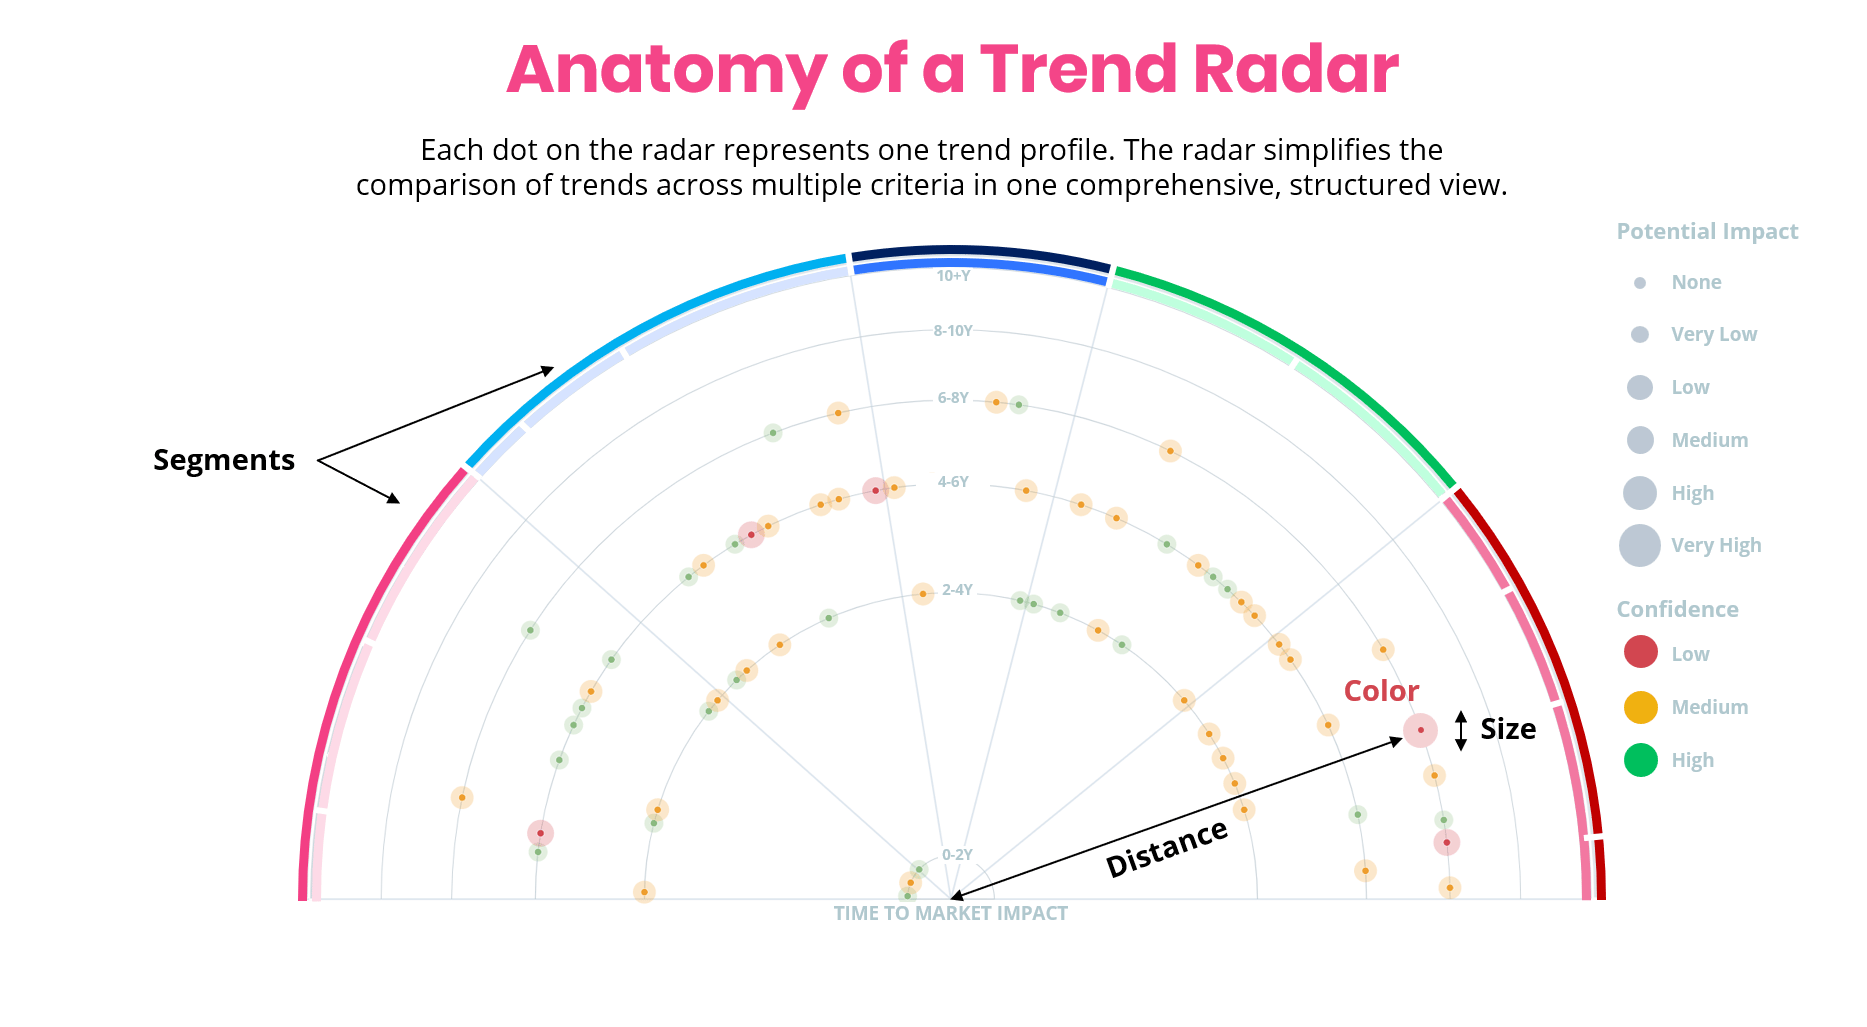
Exhibit 1: The structure of a trend radar
A trend radar is a visual tool that helps organizations identify, monitor, and prioritize emerging trends. It gives foresight and scouting teams one view of the forces shaping their business landscape, ranked by urgency and impact.
The radar pulls scattered signals into a single, shared picture. It clusters related trends, shows which ones are close to becoming actionable, and gives every stakeholder the same reference point for discussion. A trend radar earns its keep the moment it moves a decision, from a funded project to a shift in growth strategy.
Radars fail in predictable ways. These three patterns account for most stalled programs.
Trends sit on the radar as elements. Each one has a position, a color, and a paragraph of context, and that context rarely reaches a project, an owner, or a resource decision. Dolby faced this before ITONICS: its scouting method worked, but connecting insights to business units was slow and manual. Information existed. Professional workflows and decisions lagged.
.webp?width=1190&height=693&name=Dolby-Foresight-Process%20(1).webp)
Exhibit 2: The Dolby foresight process
When a trend belongs to "the innovation team" collectively, ownership dissolves. Accountability is diffuse. A signal can sit in the "act now" zone for months while responsibility floats between teams instead of resting with one person.
Many teams review the radar quarterly by default. If a trend's position stayed the same since the last review, the meeting delivers a status update instead of a decision. Worse, a fast-moving signal can cross a threshold in week three and wait eleven weeks for anyone to notice. A calendar stays blind to a signal's movement. A trigger catches it instantly.
A trend radar that changes decisions follows five steps. Each step feeds the next, from defining scope to continuous trend monitoring.
Pick the priorities the radar must inform first, then gather trends that affect them. A radar scoped to "emerging technology" collects everything.
A radar scoped to "which platform bets we fund next year" stays actionable and tied to growth strategy. Clear scope keeps the radar focused on the strategic decisions that move resources.
A trend radar is only as strong as the signals feeding it. Run a systematic process to gather signals through horizon scanning across diverse sources. Combine curated web feeds, industry news outlets, academic publications, analyst reports, and internal expert input. Each source type catches emerging trends the others overlook, and curated data from your own market outperforms a generic feed.
Weak signals are the faint, early indicators of emerging patterns: a competitor filing, a fringe startup, a shift in societal attitudes. Track these emerging issues while they are still forming. Smart trend analysis and AI-enhanced scanning excel at identifying patterns across thousands of sources faster than any manual review, spanning emerging technologies, societal shifts, and future trends. Blending these diverse sources gives a comprehensive perspective on the business environment.
Place each trend on the radar using four visual cues that group signals into coherent trend clusters and make emerging patterns easy to read.
Structuring trends this way keeps the radar clear and aligns insights with strategy at a glance.
/Still%20images/Radar%20Mockups%202025/capability-views-ease-multi-criteria-decisions-2025.webp?width=1440&height=900&name=capability-views-ease-multi-criteria-decisions-2025.webp)
Exhibit 3: An ITONICS trend radar, highlighting the impact of the trend convergence of AI
This step separates a static artifact from a decision tool. A perfect trend radar links every trend to eight things.
Establishing connections between trends, decisions, and budgets is the whole job. Wire them as you create each trend, ahead of any leadership request. These links let the radar inform strategic decisions instead of merely describing the landscape.
Neglect kills most radars long before their trends go stale, so treat ongoing trend monitoring as part of the design.
Define a cadence - like quarterly reviews - that forces action for each high-priority trend, then let triggers drive the urgent, data-driven decisions. Keep a light periodic review by exception: surface only the trends whose position, evidence, or trigger status changed within their time horizon.
This routine is also where the radar earns its role in risk management, surfacing threats early enough to act on them. Automatic notifications and AI-driven tools help you stay alerted and keep an up-to-date radar that leadership continues to trust.
The best proof that a radar drives decisions comes from teams that connected it to their portfolio. Each uses its trend radar to explore future trends and turn them into funded moves. Such tools shift a static chart into a living decision system.
Alliance SwissPass started with the dynamic trend radar to support strategic decisions across the association. The team then brought its full portfolio of projects and marketing campaigns into the same system.
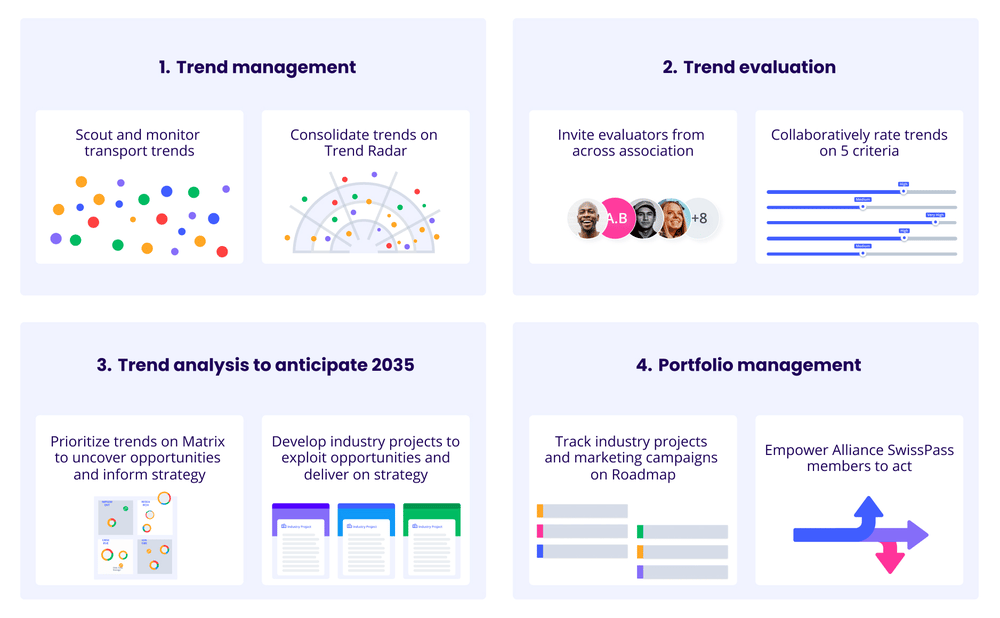
Exhibit 4: Alliance SwissPass trend analysis process
Tim Loosli, responsible for data and analytics, describes the core benefit as integrating strategic foresight with portfolio management and execution in one platform. Trend evaluation is collaborative, drawing representatives from multiple member companies.
The team then uses a prioritized view of the highest-impact trends to shape a shared growth strategy. The radar feeds the portfolio directly, rather than sitting beside it.
The Würth Group began by building a trend radar to stay ahead of change. Today, the same platform with an intuitive interface aligns three separate companies: Würth Elektronik, Würth Industrie Service, and Adolf Würth GmbH. This created structural coherence that was missing before.
Würth centralizes foresight in one system and uses the radar and matrix to prioritize trends, identify emerging opportunities, and align strategy across all three businesses. This shared process enhances alignment and makes the radar the common language for innovation decisions across the group.
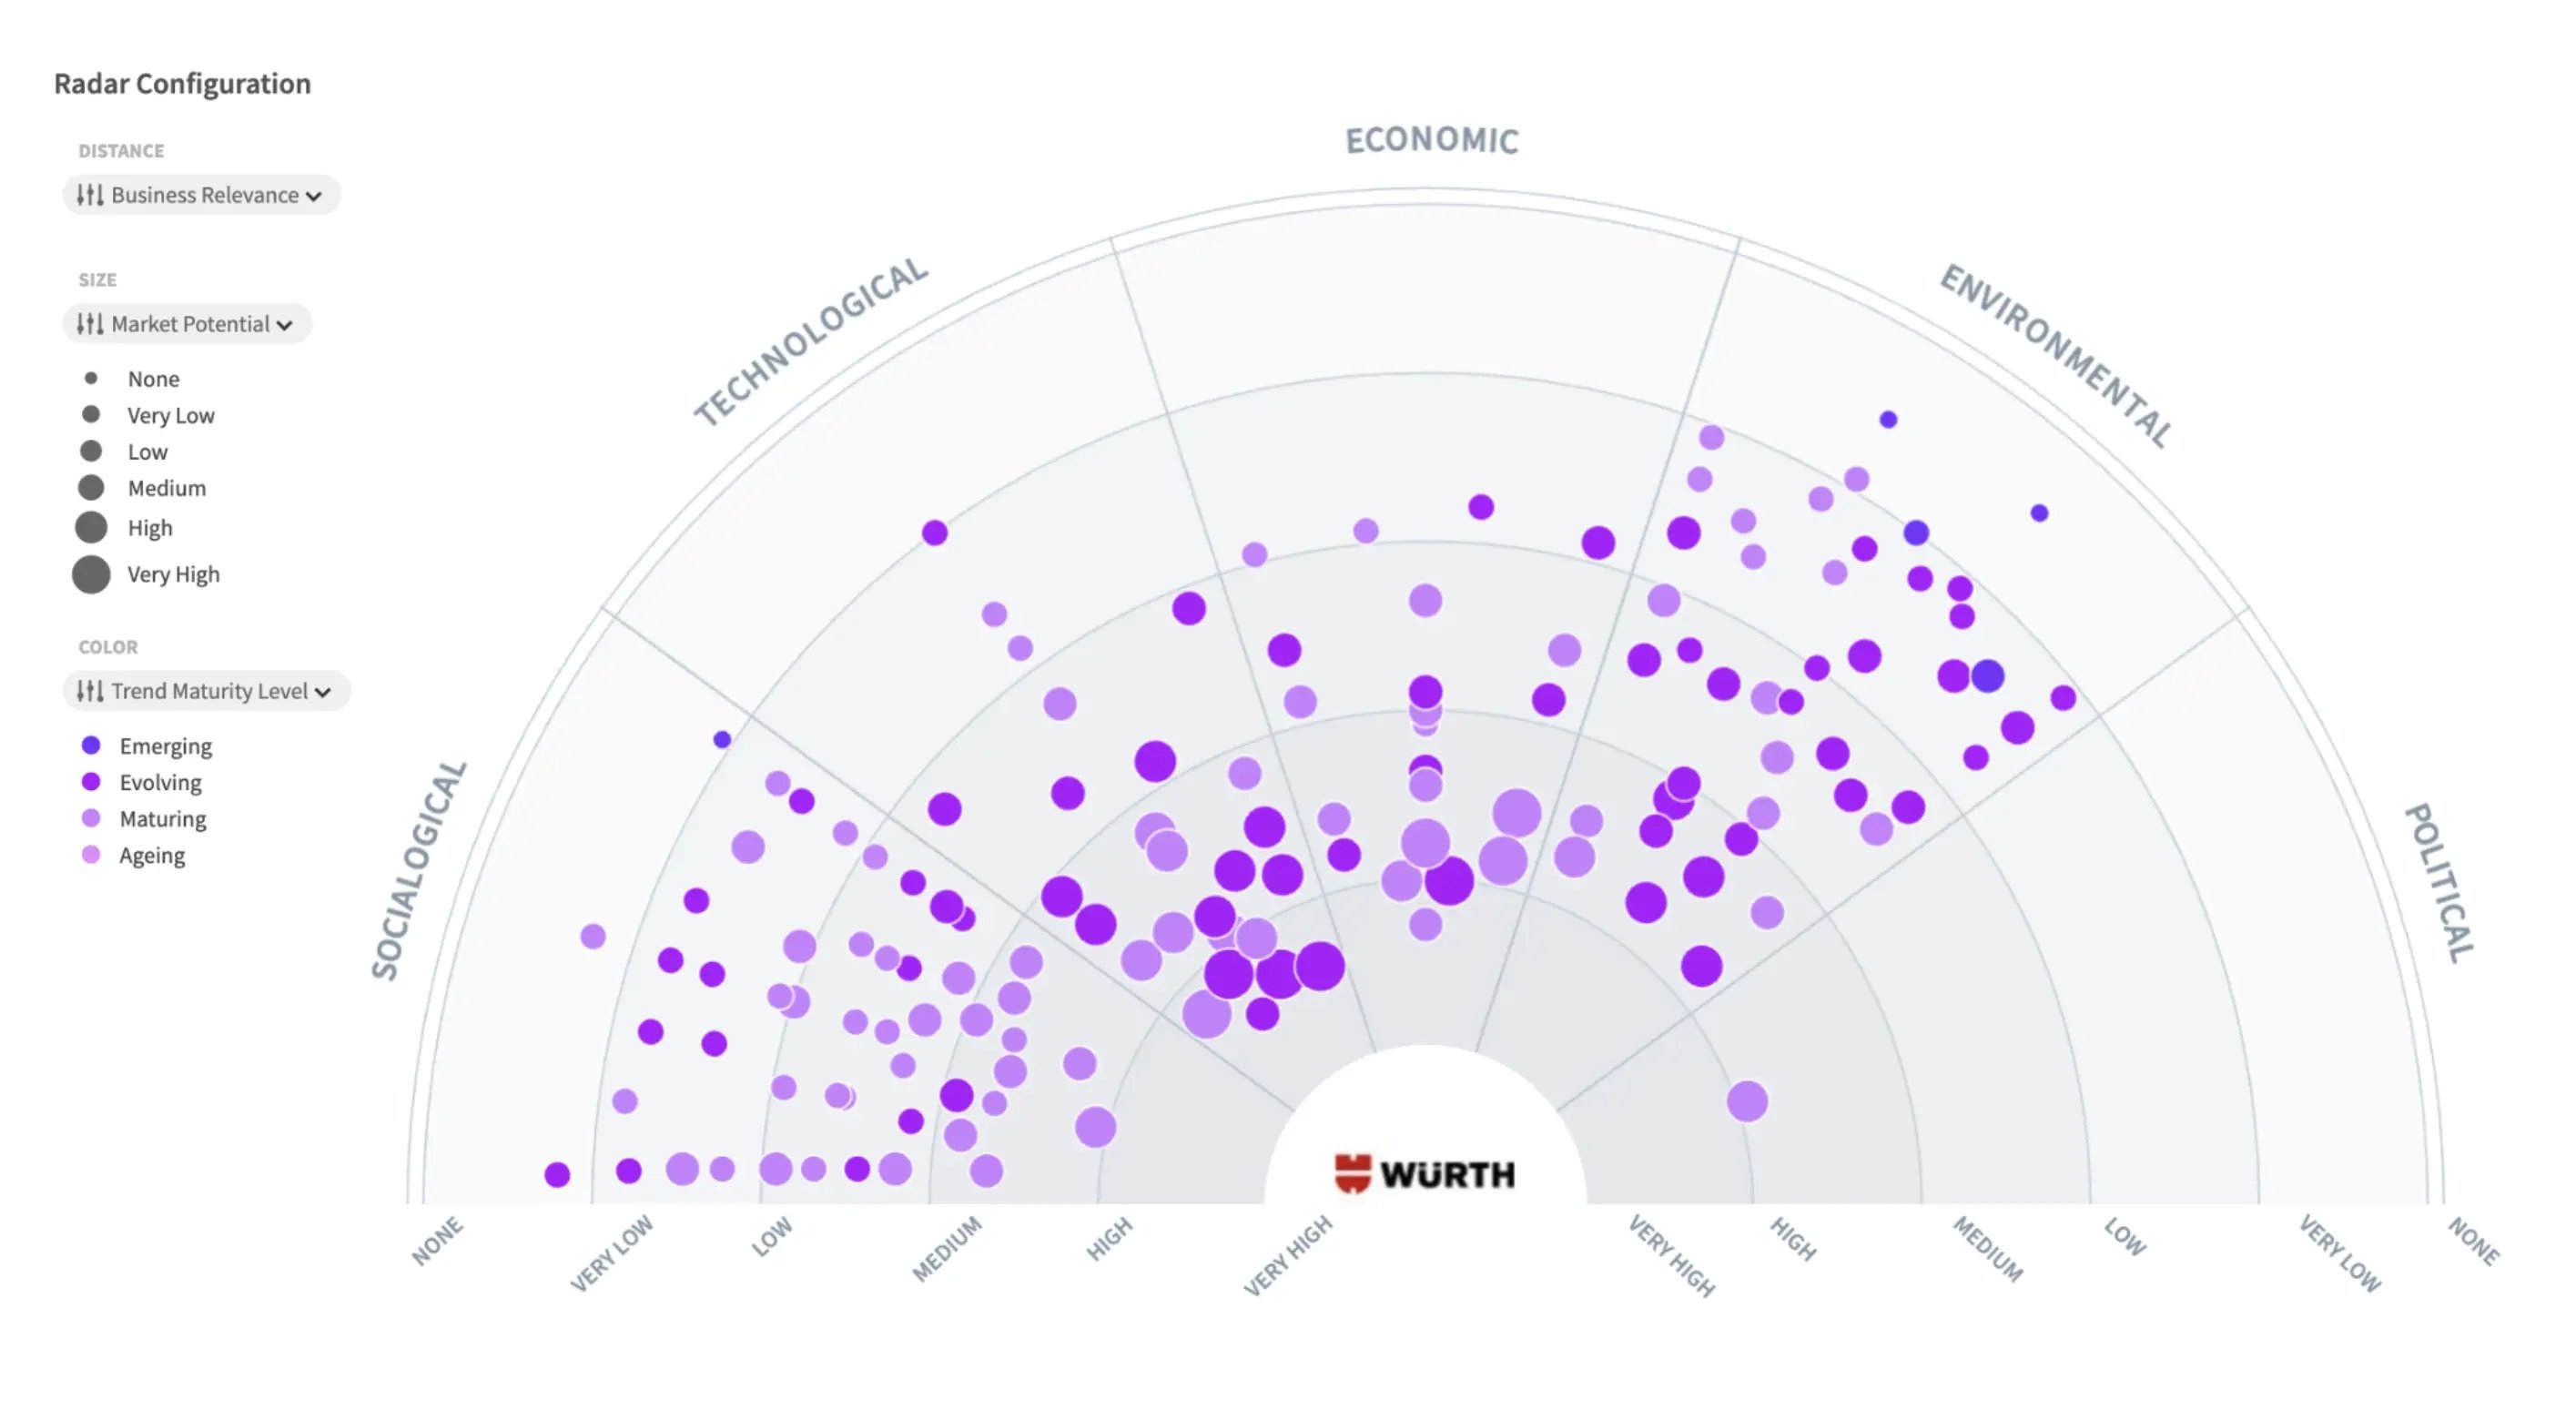
Exhibit 5: Trend radar of the company Würth
VNTR, the innovation and venturing unit at PostFinance, one of Switzerland's leading banks, runs its entire Horizon 3 process on one platform that starts with a trend radar. The foresight phase identifies signals, trends, and technologies, then derives the innovation fields worth exploring.
Each opportunity moves through phase gates where the team decides to back it, reshape it, or drop it, and every project stays traceable to the trends and signals that sparked it. Trends feed a portfolio of growth ventures that PostFinance actually funds, rather than a report that sits unread.
.webp?width=915&height=548&name=enterprise-postfinance%20(1).webp)
Exhibit 6: The PostFinance trend radar
A trend radar creates value when foresight connects to execution. ITONICS is built for that connection.

Exhibit 7: ITONICS Prism creates a trend radar
ITONICS is the only foresight software that links trend management directly to ideation and project portfolio management in one system. Build customizable trend radars from pre-configured templates, use best-practice templates, then evaluate trends with collaborative tools and configurable ratings to reach consensus and integrate insights across teams. AI-driven trend alerts and recommendations flag movement early, so foresight feeds the portfolio and facilitates deeper insights.
Map each trend to projects, opportunities, and budget lines through seamless integration with your existing tools. Create detailed reports in one click for comprehensive reporting to leadership, or embed the intuitive tool on an intranet or public page for deeper insights and stakeholder engagement.
Enterprise teams keep complete control through granular access rights and full data ownership, all on a flexible and secure infrastructure. SwissPass, Würth, and Cisco all run this model: one platform where trends, evaluations, projects, and budgets connect.