


About 33% of transformational innovation projects end up underfunded. The consequence isn't just delayed launches or missed opportunities. It's systematic competitive disadvantage. While competitors fund the right projects at the right time, underfunded initiatives stall in the innovation pipeline, burn resources without building value, and miss market windows that won't reopen.
The root cause isn't capital scarcity or lack of good ideas. Only 26% of companies track portfolio-level metrics, which means 74% fund innovation projects based on presentations rather than proof.
This article shows how to operationalize tech funding at portfolio level through evidence-based decision-making. You'll learn how to map technology initiatives to risk and return, stage tech investments by evidence thresholds at each gate, and make value progression visible in real time across your innovation portfolio.
Why tech funding fails
The comparability problem in innovation portfolio management
The breakdown happens when decision makers cannot systematically compare initiatives. A manufacturing automation project competes against a data analytics platform and a cybersecurity upgrade. Each promises returns. None provides comparable evidence across the same evaluation criteria.
Innovation practitioners recognize this pattern immediately. Twenty teams pitch during quarterly planning. All claim 3x ROI. Half have zero customer validation. The CFO asks which initiatives to fund. Without systematic methods for prioritizing projects, organizations default to funding whoever presents best, whichever teams hold political capital, or whatever aligns with the CEO's latest priority.
Early-stage exploration carries fundamentally different risk profiles than mature product projects approaching deployment. A stage-one prototype operates with untested hypotheses and high technical uncertainty. A stage-three commercialization effort brings validated demand and proven delivery capability. Yet most organizations evaluate both using identical frameworks.
PowerPoint decks promise similar returns regardless of evidence stage. Market size estimates substitute for customer validation. Technical feasibility claims replace prototype demonstrations. Financial projections assume away execution risk. When a $5 million request for unproven technology competes against a $2 million request for validated deployment, which deserves funding? Without evidence-based thresholds at each stage, comparison becomes impossible.
What separates funded projects from rejected ones
Consider the diagnostic question: How many of your current innovation projects could defend their funding requests with customer data rather than market projections? The answer reveals whether your organization funds based on evidence or persuasion.
Funded projects demonstrate:
-
-
Measurable risk reduction at each stage
-
Evidence progression from signal to hypothesis to proof
-
Strategic alignment with portfolio priorities
-
Comparable data across evaluation criteria
-
Learning velocity that justifies continued investment
-
Unfunded projects typically show:
-
-
Static projections without validation
-
Feature lists instead of proof points
-
Misalignment with strategic objectives
-
Incomparable claims across initiatives
-
Unclear evidence requirements for the next stage
-
The distinction matters because it determines which innovations reach market and which stall in development. Organizations that fund projects with evidence move faster. Those that fund based on presentation quality move slowly and waste capital on initiatives that fail later after consuming more resources.
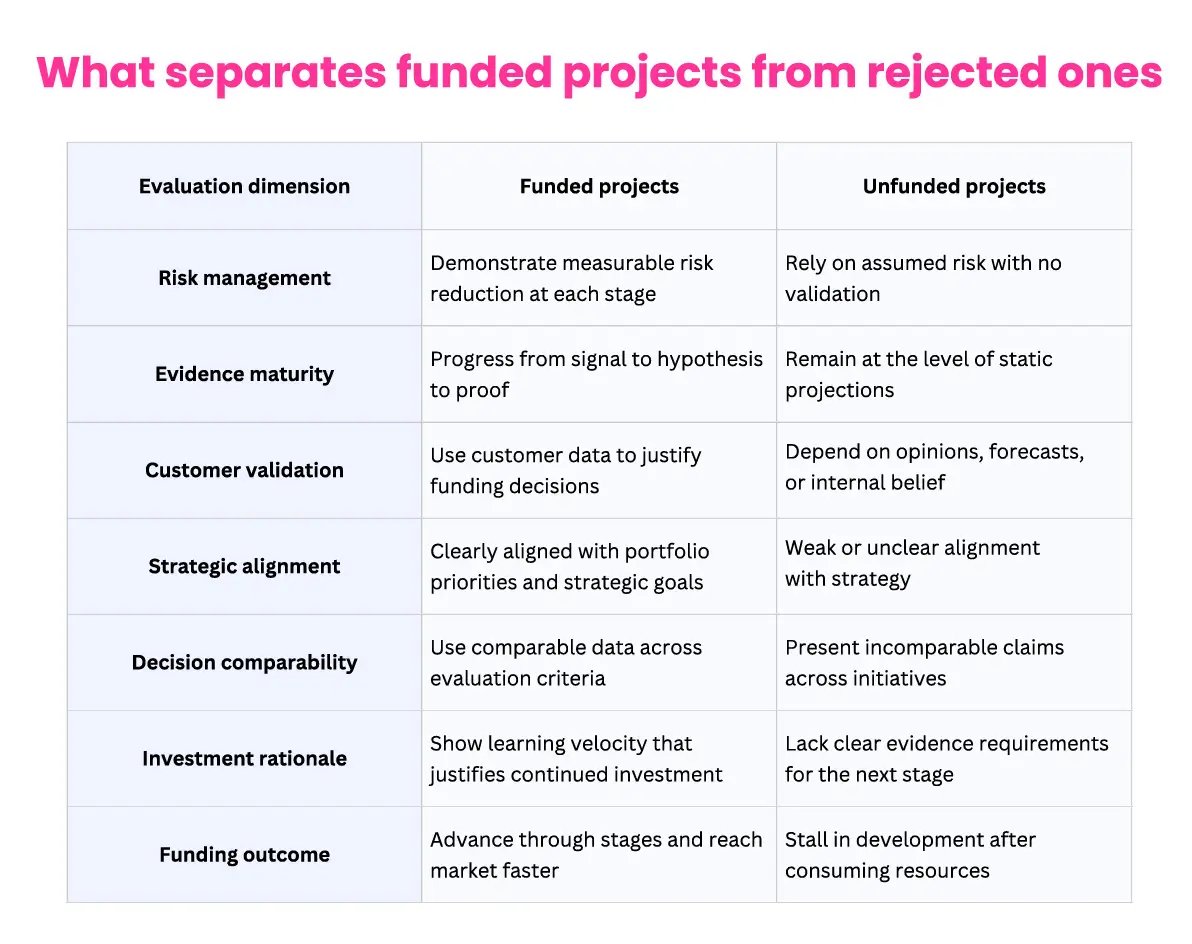
Exhibit 1: Comparison of funded versus rejected innovation projects, highlighting how evidence quality, risk reduction, and strategic alignment determine funding decisions.
Funding the right projects through risk reduction
Research on innovation portfolio management confirms that systematic risk reduction is directly linked to project success and informed decision-making around resource allocation. Strategic alignment impacts projects by making them 57% more likely to deliver business benefits.
Three risk categories determine funding confidence and enable systematic comparison across different project types:
-
-
Technical risk measures whether the solution works at scale. Product development teams validate core functionality through prototypes and pilots, providing concrete project performance data that replaces feasibility assumptions.
-
Market risk assesses customer demand through actual commitments rather than projections. Signed pilot agreements, purchase intent from real buyers, or validated customer satisfaction provide evidence that demand exists before significant capital deployment.
-
Execution risk evaluates operational delivery capability across different environments. Scalability proof demonstrates the solution works beyond controlled lab settings or single-site pilots.
-
Projects that make risk reduction visible at each stage gate secure funding faster because decision makers can see progression from technical proof to market validation to delivery capability. This visibility creates confidence that capital is funding proven value, not projected hope.
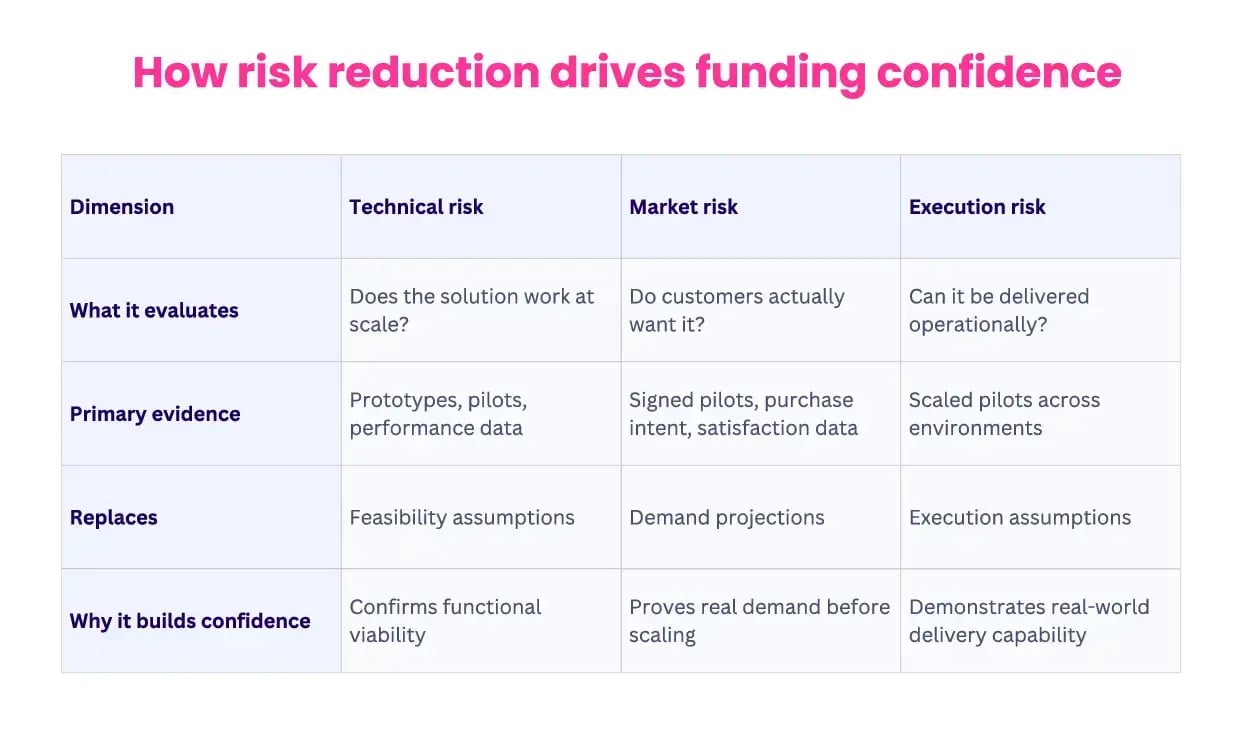
Exhibit 2: How systematic reduction of technical, market, and execution risk increases funding confidence and enables faster, evidence-based investment decisions.
The staged evidence framework
How stages and gates accelerate time to market
Tech initiatives that demonstrate measurable risk reduction through staged proof points secure capital 3-5x faster than those relying on projections alone. This velocity advantage compounds: faster funding decisions mean faster market entry, which creates first-mover advantage before competitors mobilize.
Each funding gate requires new evidence, not updated forecasts:
-
-
Stage one validates technical approach through pilot deployments or prototypes. Concrete performance data replaces feasibility claims.
-
Stage two proves market demand through customer commitments and signed pilots. Purchase intent from real buyers replaces market projections.
-
Stage three demonstrates operational scalability across environments. Confirmed delivery capability replaces execution assumptions.
-
When initiatives track evidence systematically, funding accelerates because reviews focus on data rather than deck quality.
Matching resources required to demonstrated value
Traditional funding requests full capital upfront based on projected returns. Evidence-based funding stages investment according to proof accumulated at each gate. This shifts the evaluation question from "how much money do you need?" to "what evidence justifies the next allocation?"
Stage one: Signal validation ($50K-$100K, 6-8 weeks)
-
-
Confirms market trend through research
-
Validates technical approach with experts
-
Evidence threshold: proven technical viability before next gate
-
This first stage establishes foundational proof before significant capital commitment. Organizations risk minimal resources to validate whether an opportunity warrants deeper investment.
Stage two: Hypothesis testing ($200K-$500K, 3-4 months)
-
-
Demonstrates core functionality with working prototype
-
Secures customer validation through pilot commitments
-
Evidence threshold: signed commitments from actual buyers
-
Stage two converts technical possibility into market reality. Customer commitments provide evidence that validates demand before scaling production or go-to-market investments.
Stage three: Business case proof ($1M-$5M, 6-12 months)
-
-
Confirms operational delivery through scaled pilots
-
Validates financial returns with actual performance data
-
Evidence threshold: tested go-to-market strategy with proven unit economics
-
Stage three removes execution uncertainty. Scaled pilots demonstrate the solution works across different conditions, unit economics hold under real operational pressures, and go-to-market approaches drive customer acquisition at acceptable costs.
Each funding decision relies on demonstrated progress rather than updated projections. Portfolio managers gain confidence in allocating resources across competing demands because they can see which projects have reduced the most risk.
Without staged evidence thresholds, organizations either underfund promising initiatives (killing them prematurely) or overfund unproven concepts (wasting capital that could support multiple smaller experiments). Staging matches investment to evidence, optimizing both capital efficiency and innovation velocity.
Aligning the innovation portfolio with strategic objectives
Research shows 54% of executives struggle to align innovation strategy with business strategy, yet those who succeed see significantly higher project success rates and better resource allocation outcomes.
Alignment requires standardized evaluation across all active projects. Every tech initiative must answer identical questions:
-
-
What risk does this address? Operational efficiency, market competitiveness, regulatory compliance, or strategic resilience?
-
What evidence stage has been reached? Signal validation, hypothesis testing, or business case proof?
-
What resources are required for the next threshold? Capital, team capacity, timeline commitments?
-
Strategic priorities provide the framework for prioritizing projects within the innovation pipeline. When corporate strategy prioritizes operational resilience, supply chain risk reduction projects rank higher in the portfolio. When growth drives objectives, projects with validated market entry attract capital first.
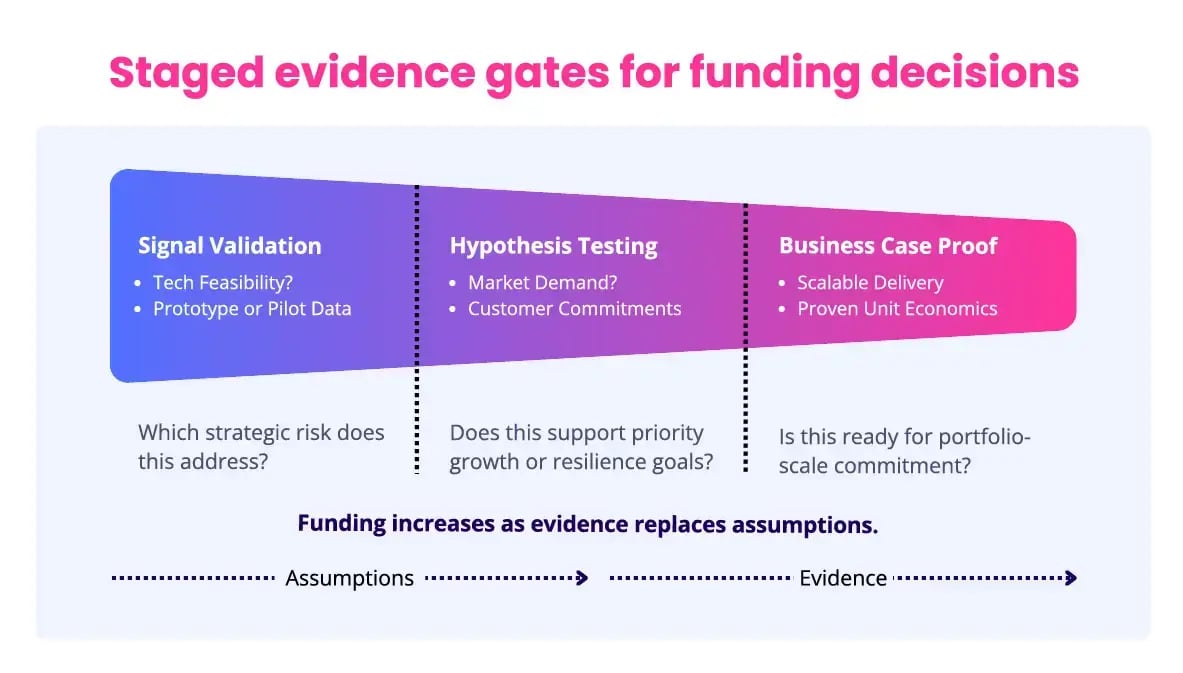
Exhibit 3: How technical, market, and execution proof guide faster, more aligned funding decisions across the innovation portfolio.
Operationalizing the stage gate model
Fixing three coordination failures in the innovation pipeline
Most organizations understand that managing an innovation portfolio requires evidence. Few operationalize it systematically. The gap between knowing and doing comes down to three coordination failures: role misalignment, timing mismatches, and visibility gaps.
Over 70% of CFOs now shoulder responsibilities beyond traditional finance, including technology investment decisions. Innovation leaders scout opportunities. Finance teams control capital. Executives make final calls. Everyone operates with different information, different timelines, and different success criteria.
The dysfunction isn't individual incompetence. It's structural misalignment. Innovation leaders present opportunities that finance cannot compare because data formats differ across projects. Finance requests evidence that innovation teams haven't gathered because requirements weren't specified upfront. Executives see conflicting recommendations without clear decision criteria.
Fixing these coordination failures requires three synchronized capabilities: building organizational trust to execute on evidence, synchronizing evidence delivery with funding cycles, and creating real-time visibility across innovation projects.
Building organizational trust to execute on evidence
Even with perfect evidence staging, funding stalls when innovation leaders lack the relationships to move decisions forward. Success requires not just structured portfolios but also the organizational trust to execute on evidence.
The fix demands three aligned functions working from shared evidence:
- Innovation leaders structure the innovation portfolio by organizing projects by stage and risk profile, defining evidence thresholds at each stage gate, tracking progression across the innovation pipeline, and making learning visible in real time.
- Finance teams evaluate four dimensions: the ask (specific capital, team capacity, timeline), risk stage (exploration, validation, commercialization), supporting evidence (customer commitments, pilot data, technical proof), and strategic consequence (cost of not funding this initiative).
- Executives allocate capital to strategic initiatives demonstrating rapid hypothesis testing, measurable risk reduction at each gate, progress against stated evidence thresholds, and alignment with strategic priorities.
Synchronizing evidence delivery with funding cycles
Most organizations run annual or quarterly budget planning. Tech initiatives must time evidence delivery to these decision windows. Projects presenting proof points outside review periods wait months for capital, losing momentum and market advantage.
Companies using structured stage gate processes report cycle time reductions of 30%, but only when reviews sync with when capital actually gets allocated. Organizations that map the innovation process to budget cycles reduce funding delays by 40-60%. This synchronization turns sporadic funding into systematic capital flow.
Creating real-time visibility across innovation projects
Nearly 60% of large organizations now use innovation dashboards to communicate portfolio performance. These systems don't just track projects. They create decision infrastructure by making evidence progression visible across signals, experiments, and outcomes.
Innovation portfolio management systems track three evidence layers:
-
- Signal layer captures external trends, competitive moves, and technology developments through systematic research. Organizations monitoring weak signals identify relevant opportunities 3-5x faster than those responding reactively.
- Experiment layer documents hypotheses tested, prototypes built, and pilots run. Tracking what was learned, not just what was done, accelerates knowledge accumulation across the innovation pipeline. Failed experiments become organizational knowledge rather than wasted effort when learnings are captured systematically.
- Outcome layer measures business impact through project value delivered, strategic objectives achieved, and resources required versus planned. This layer closes the learning loop by showing which types of initiatives deliver value and which consume resources without advancing objectives.
When these three layers connect in a single system, decision makers see real-time progression without hunting through email for updates. Companies report dashboard implementation reduces status reporting time by 40+ hours per initiative per quarter while improving decision quality.
Visibility isn't about transparency for its own sake. It's about creating the information infrastructure that enables fast, confident decisions.
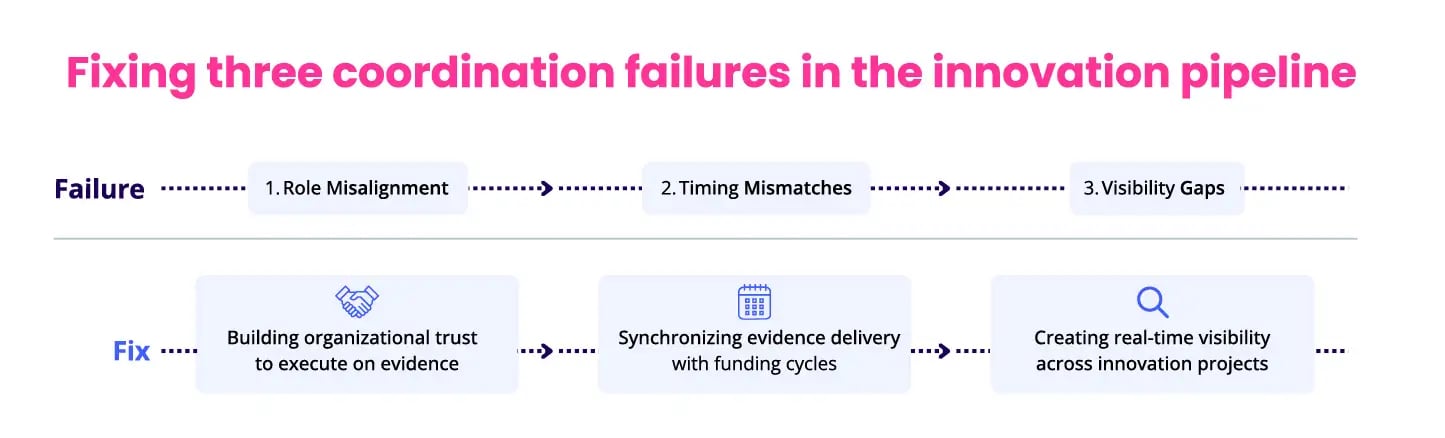
Exhibit 4:How aligning roles, funding timing, and real-time visibility removes coordination failures and accelerates evidence-based decision-making across the innovation pipeline.
Implementing portfolio management infrastructure at scale
Companies using structured stage gate processes achieve success rates between 63-78%, compared to just 24% for those using ad hoc development approaches. The difference lies in operationalizing evidence thresholds, not just having review meetings. Here are the four essential steps to implement this at scale:
Step 1: Map the innovation portfolio to risk and return
Portfolio balance drives innovation performance. Organizations achieving best practice allocate capital strategically:
-
-
High-risk, high-return exploratory bets: 10-20% of investment
-
Low-risk, high-return proven opportunities: 50-60% of investment
-
Low-risk, low-return incremental improvements: 20-30% of investment
-
High-risk, low-return initiatives: Avoided or killed quickly
-
Innovation portfolio composition matters more than individual project brilliance. Systematic distribution across risk-return profiles reduces overall exposure while maintaining innovation velocity.
Step 2: Define evidence thresholds at each gate
Modern stage gate implementations reduce development cycle times by 30% while improving success rates. The key lies in defining clear evidence requirements at each funding gate:
Stage gates fail when they become bureaucratic checkpoints that slow progress. They succeed when they become evidence thresholds that accelerate funding for projects that prove viability while quickly killing projects that don't.
Step 3: Make progression comparable through systems
Real-time visibility transforms funding velocity. Four mechanisms enable comparability:
- Standardized dashboards display which active projects hit evidence thresholds, which stall without progress, and where bottlenecks emerge.
- Automated alerts flag initiatives missing milestones or consuming resources without demonstrating learning.
- Exception-based governance focuses leadership attention on outliers rather than routine updates, reducing status meeting time while improving oversight quality.
- Dynamic reallocation enables rapid capital shifts from stalling initiatives to those proving hypotheses faster than expected.
When progression becomes visible across the innovation portfolio, funding decisions compress from months to weeks. Organizations achieve higher innovation returns through systematic evidence accumulation rather than episodic pitch competitions.
/Videos/HiFi-Animation-Portfolio-Monitor-Portfolio-Health.png?width=1200&height=720&name=HiFi-Animation-Portfolio-Monitor-Portfolio-Health.png) Exhibit 5: ITONICS portfolio management system enabling evidence-based stage gates, real-time visibility, and comparable funding decisions across the innovation portfolio.
Exhibit 5: ITONICS portfolio management system enabling evidence-based stage gates, real-time visibility, and comparable funding decisions across the innovation portfolio.
Step 4: Build infrastructure that scales
Organizations using portfolio management systems report 20% improvement in innovation ROI tracking and 30% time savings in status reporting. Most companies try to operationalize evidence staging with spreadsheets and quarterly reviews. This approach fails because spreadsheets cannot provide real-time visibility, automated alerts, or dynamic comparability across different project types.
ITONICS Innovation OS provides the operating system for portfolio-level funding decisions. Instead of scattered spreadsheets and isolated presentations, innovation leaders gain integrated infrastructure across portfolio governance, decision readiness, capital velocity, and evidence accumulation.
When funding moves from debate to infrastructure, organizations accelerate innovation without increasing risk. Innovation portfolio management becomes systematic. Evidence drives capital. Decision makers gain confidence in resource allocation because they can see which projects have reduced the most risk at each stage.
The transformation is operational, not aspirational. Your innovation portfolio moves faster. Finance spends less time evaluating and more time allocating. Executives make confident decisions with clear data. Projects that demonstrate value get funded. Those that don't get cut before wasting resources.
Stop funding what sounds good. Start funding what proves value. The infrastructure exists. The framework works. The only question is whether you'll operationalize it before your competitors do.


