When Excel stops working for R&D portfolio management

For decades, Excel has been the default for managing large portfolios. Its calculation power and flexibility let practitioners shape the tool to their own process. Version control, decision traceability, and stage-gate workflows, however, run on manual effort, and that effort grows with every project. The useful question is: at what point do spreadsheets cost more decision time than they save?
Excel is the tool R&D portfolio buyers use most often. In 2,193 analyzed ITONICS sales calls, buyers named Excel as their current tool in 435 calls. That is 19.8%, ahead of every named software vendor. The spreadsheet is the real incumbent in R&D management software.
This article names five break points, the requirements for R&D projects, and the business case for a successful transition.
| Job | Excel | Portfolio system of record |
|---|---|---|
| Project business case, NPV | Strong: formulas, what-if analysis | Does calculations in the back |
| Status of 50+ projects | Manual data entry per project | Live project properties |
| Gate decisions | A tab or an email | Phases, gates, and audit trails |
| Cross-unit roll-up | Copy and paste | Aggregated views across units |
| Market and technology signals | Separate files | Linked to the projects they affect |
| Resource allocation | An hours tab per project | Demand summed across projects |
| Board reporting | Slides rebuilt each quarter | Dashboards and PPT export from templates |
Exhibit 1: Excel vs. a portfolio system of record, job by job
Excel runs most early R&D portfolio management because every portfolio starts small. A team of ten engineers tracks a dozen projects. One workbook holds all projects, and its owner knows every cell.
The typical file has one row per project. Columns hold owner, phase, budget, launch date, and a traffic light. A second tab holds scoring for project prioritization. A third tab lists the resource pool with names, hours, and project codes.
Many teams add a bubble chart for risk versus value. A separate workbook per project holds the business case, project costs, and financial data. For one team, this works well.
Excel calculates, and finance trusts its formulas. Portfolio tools that force this logic into rigid input forms lose the controller on day one.
The lesson for any Excel alternative: replace the record and keep the calculator.
The break point arrives once the portfolio becomes increasingly complex. More projects, more business units, and more gates mean more people who need the same answer at the same time. Treat any two of the five signals below as your trigger to act.
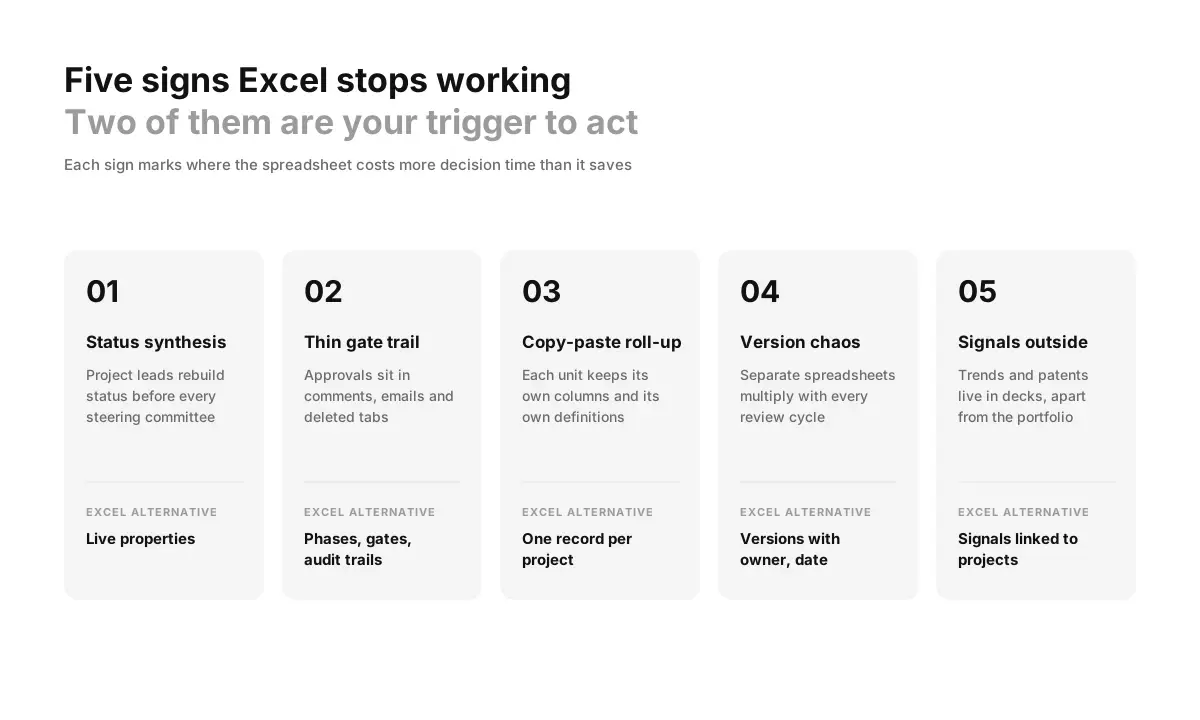
Exhibit 2: Five signs Excel stops working for R&D portfolio management
Before every steering committee, project managers chase updates, merge Excel files, and rebuild charts. The figures are outdated when the meeting starts. Leadership makes decisions based on last month's portfolio, and reporting turns into a job of its own.
Dräxlmaier quantified this cost. It centralized idea management and pre-development workflows on ITONICS and cut manual project reporting effort by 70%. The team reinvested that focus in innovation and development projects.
The phase gate methodology depends on documented decisions. Who approved the project, against which criteria, with which budget?
In Excel, that history sits in a cell comment, an email, or a deleted tab. Six months later, the project management office repeats the same debate.
Audit trails fix this. Each gate decision becomes evidence for the next one, and the right projects pass on documented criteria.
Each business unit keeps its own spreadsheets with its own columns. The project management office merges them by hand. Definitions drift, so "Phase 2" means different things in two units. Duplicate projects stay hidden until someone compares the spreadsheets side by side.
Goldbeck lived the cost of that fragmentation. Many departments scouted startups and ran pilots in parallel. People spent significant time finding out who had talked to whom, and work was duplicated. The organization needed one place that showed every initiative and its link to broader business goals.
"Portfolio_v7_final_JK.xlsx" is a familiar file name in every R&D organization. Separate spreadsheets multiply with each review cycle. Data quality drops with every copy.
The cost compounds with multiple projects per owner. Portfolio managers spend their focus on reconciling versions while decisions on the projects that matter wait. Centralizing information in one record ends that cycle.
Trend reports and patent scans live in slide decks, while the project portfolio lives in Excel. The link between them exists in a few people's heads. These data silos cause missed opportunities, because a technology shift reaches the portfolio a quarter late.
Sartorius closed this gap. Its Corporate Research department connected trends, technologies, and innovation projects in one system. Its 60 members gained a holistic view.
Most Excel alternatives fall into three groups:
The first two of these Excel alternatives keep the core problem. Project management software such as MS Project tracks project execution: tasks, due dates, and progress. SharePoint keeps the spreadsheets accessible while the data inside stays fragmented. Only dedicated software answers the portfolio question: which projects get the next euro, and which three stop? Generic project management tools lack scoring, gates, and strategic alignment with business priorities.
Use dedicated R&D portfolio management software that meets four requirements. Each one answers a break point above. Test these key features with your own data. The project portfolio management software guide covers general criteria for project portfolio management.
Every project becomes one record with the same properties across all units. Phases and gates are configured once and applied everywhere. Permissions control who edits and who reads.
Agree on these definitions before any import, because the software only enforces what the business units agreed.
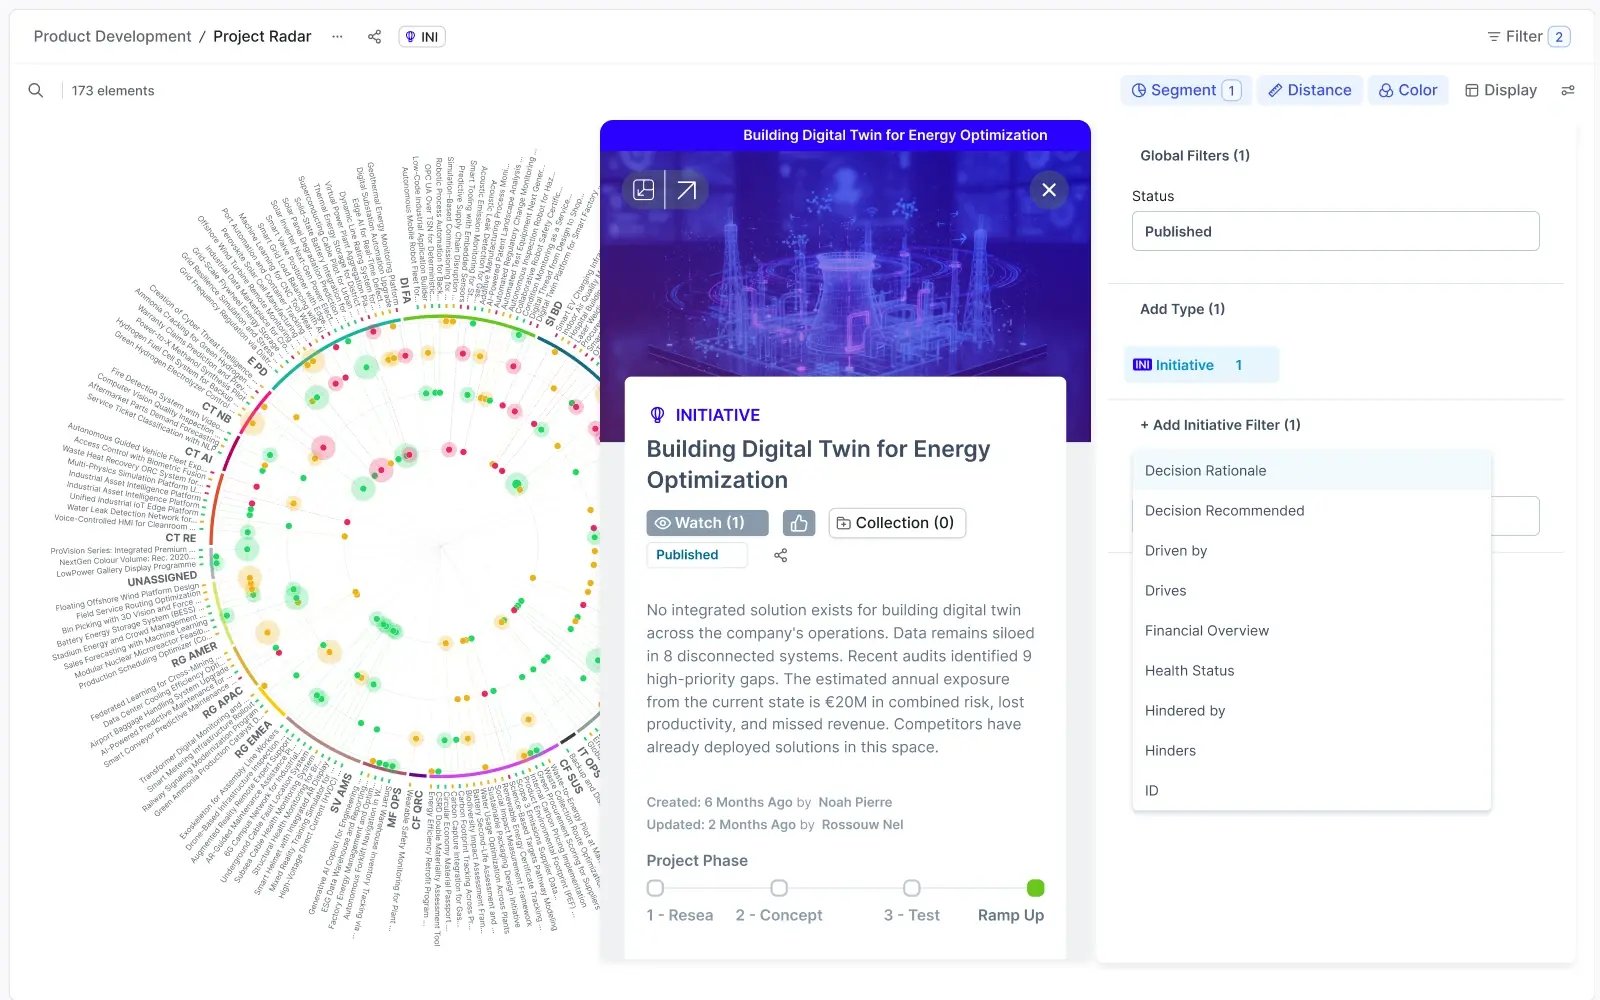
Exhibit 3: Project radar showing projects with status "challenging" inside ITONICS
Dashboards read live data and turn every change into real-time insights. Leadership gets real-time visibility into budget, phase, progress, and risk across all projects. Boards that still want slide reporting get it from PPT export with fixed templates. Organizations that standardize their reporting on Power BI embed those dashboards instead.
Budgets move faster than people. A specialist team takes months to hire and train.
The software must sum resource demand across multiple projects and expose resource constraints early. Portfolio-level resource management shows the financial impact of moving a team, so resource allocation follows strategic alignment. Leaders then see which strategic goals are reachable this year and which projects wait.
The new system must import existing Excel files and exchange data with other systems through an API. Actuals from ERP belong in the ERP and flow in through that API. Each number gets one owner and one home, which ends double entry and protects data quality. The right tools also keep a clean decision history for later predictive analytics.
Audit trails log every change, and IT will ask for SSO, ISO 27001, and SOC 2 before the first pilot.
The hybrid approach replaces Excel as the record and keeps it as the model. Picture a portfolio of 150 projects in four business units, each project with its own business case workbook.
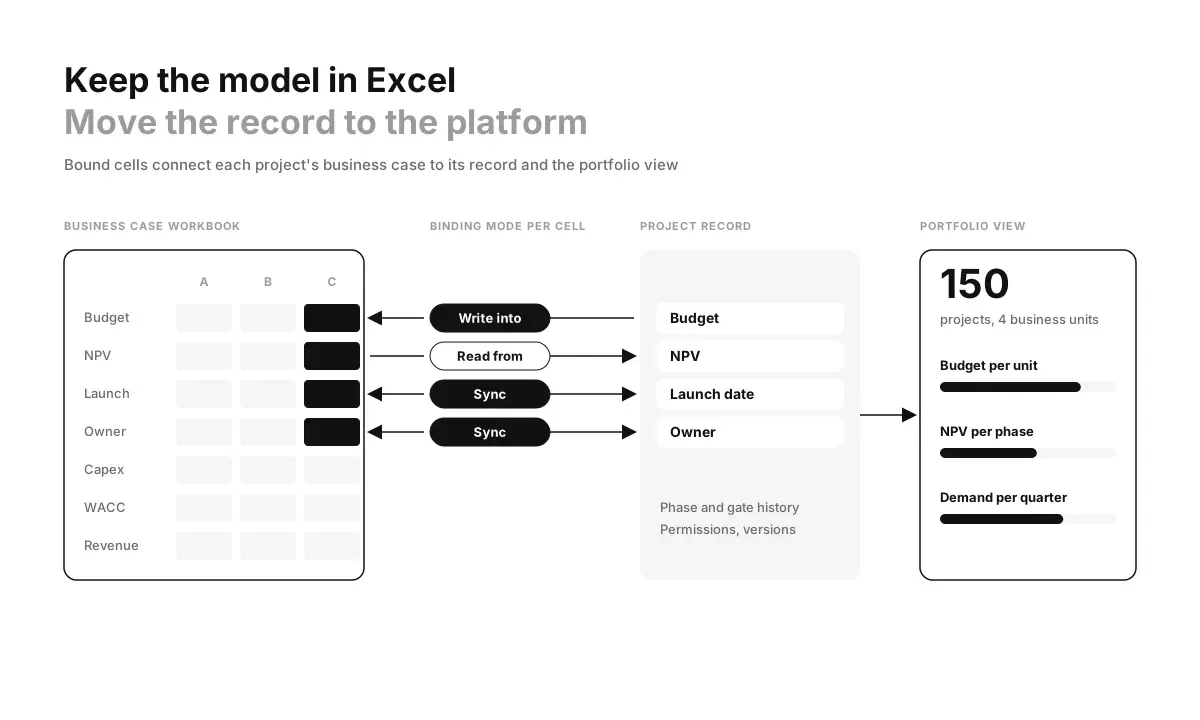
Exhibit 4: The hybrid model, with business case cells bound to the project record and rolled up to the portfolio
Use one workbook template per project type. Each project gets its own copy, which matches how business cases already work. Identify the 10 to 20 cells leadership reads: budget, NPV, launch date, owner, and resource demand.
Bind those cells to properties of the project record. Every other cell in the workbook stays a working calculation.
Push inputs from the platform into the workbook. Let Excel recalculate. Read the result back as a property. Finance keeps its model, and data entry happens once.
The portfolio view then sums the bound results across all 150 projects. Total budget per unit, NPV per phase, and resource demand per quarter come from live properties instead of a merged file. A central NPV or capacity model stays in Excel too. It reads summed business results from a Table view export or the API.
Each new workbook upload becomes a version with uploader and date. The version history replaces file names like "final_v3" and gives the controller a trail for every change.
Build the business case to replace Excel on stop decisions. Saved reporting hours fund part of the switch. Earlier stop decisions fund the rest. In the model below, they carry seven times more business value.
It uses the 150-project portfolio from above. Every figure is an assumption, so swap in your own data.
| Line item | Excel status quo | Portfolio platform | Assumption |
|---|---|---|---|
| Status updates by project leads | 1,800 h | 975 h | Excel: 3 h per project before each of 4 quarterly reviews. Platform: 15 min per project every two weeks |
| PMO consolidation and steering deck | 320 h | 32 h | Excel: 20 h per unit and cycle. Platform: 8 h of dashboard review per cycle |
| Version reconciliation | 184 h | 0 h | 4 h per week in the PMO |
| Total hours per year | 2,304 h | 1,007 h | |
| Cost at EUR 90 per hour | EUR 207k | EUR 91k | Fully loaded internal rate |
| Budget freed by earlier stops | EUR 0 | EUR 800k | 8 projects stopped one quarter earlier at EUR 100k burn per quarter |
| One-time rollout | EUR 0 | EUR 36k plus license | 400 internal hours over two quarters |
Exhibit 5: Illustrative annual business case for a 150-project R&D portfolio
The visible cost is reporting time. Project leads spend about 1,800 hours a year preparing status. The project management office adds roughly 500 hours of merging, decks, and version checks.
The invisible cost is latency. A project that should stop keeps burning budget until the next quarterly review surfaces the evidence.
The platform cuts the hours to about 1,000 a year, because updates become short and frequent. That saves roughly EUR 117k a year.
Against this stands the license and a two-quarter rollout for the organization. Budget about 400 internal hours for definitions, the security review, and one pilot cycle. In Germany, add the works council if the tool holds named-person capacity data.
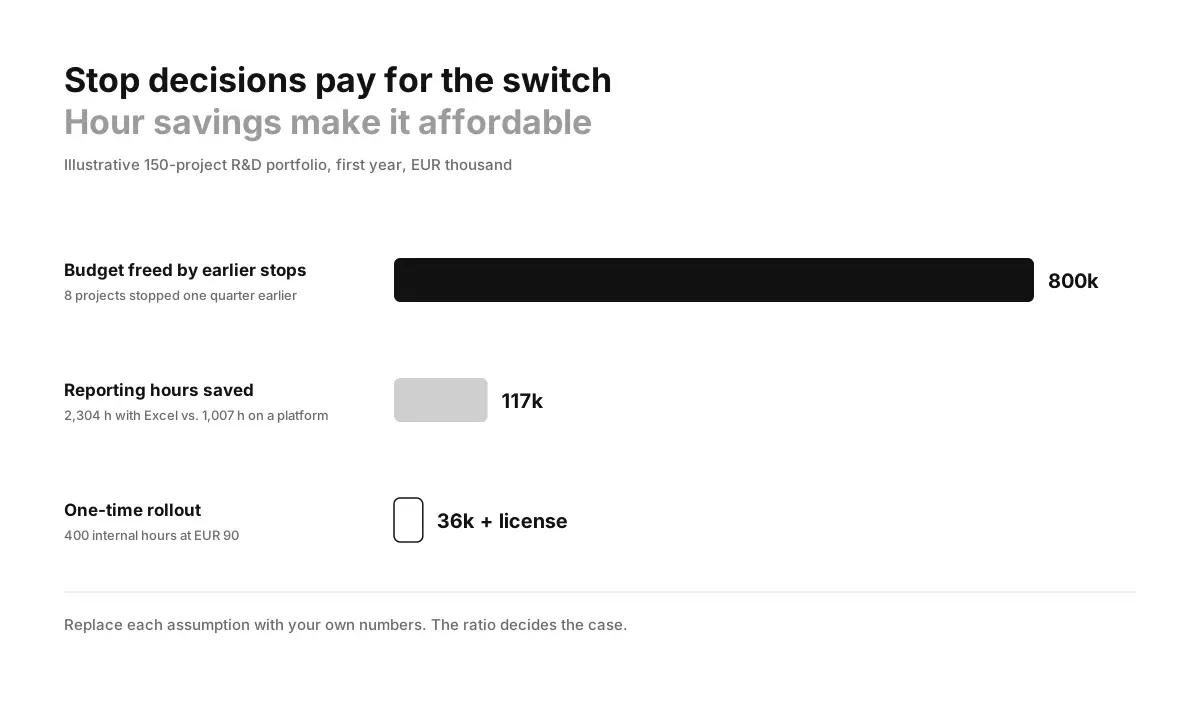
Exhibit 6: Budget freed by earlier stops vs. hours saved and rollout cost
The payback comes from decisions. Assume live data lets you stop 8 of 150 projects one quarter earlier. At EUR 100k burn per quarter, that frees EUR 800k for stronger projects.
Put that number in front of your CFO first. Hour savings prove business value and make the license affordable. Earlier stop decisions deliver the business outcomes a steering committee funds, and they set the bar for Excel alternatives.
ITONICS is strategic portfolio intelligence for enterprise R&D and innovation. It connects market intelligence, strategic priorities, and the R&D portfolio in one platform, with Excel as part of the workflow.
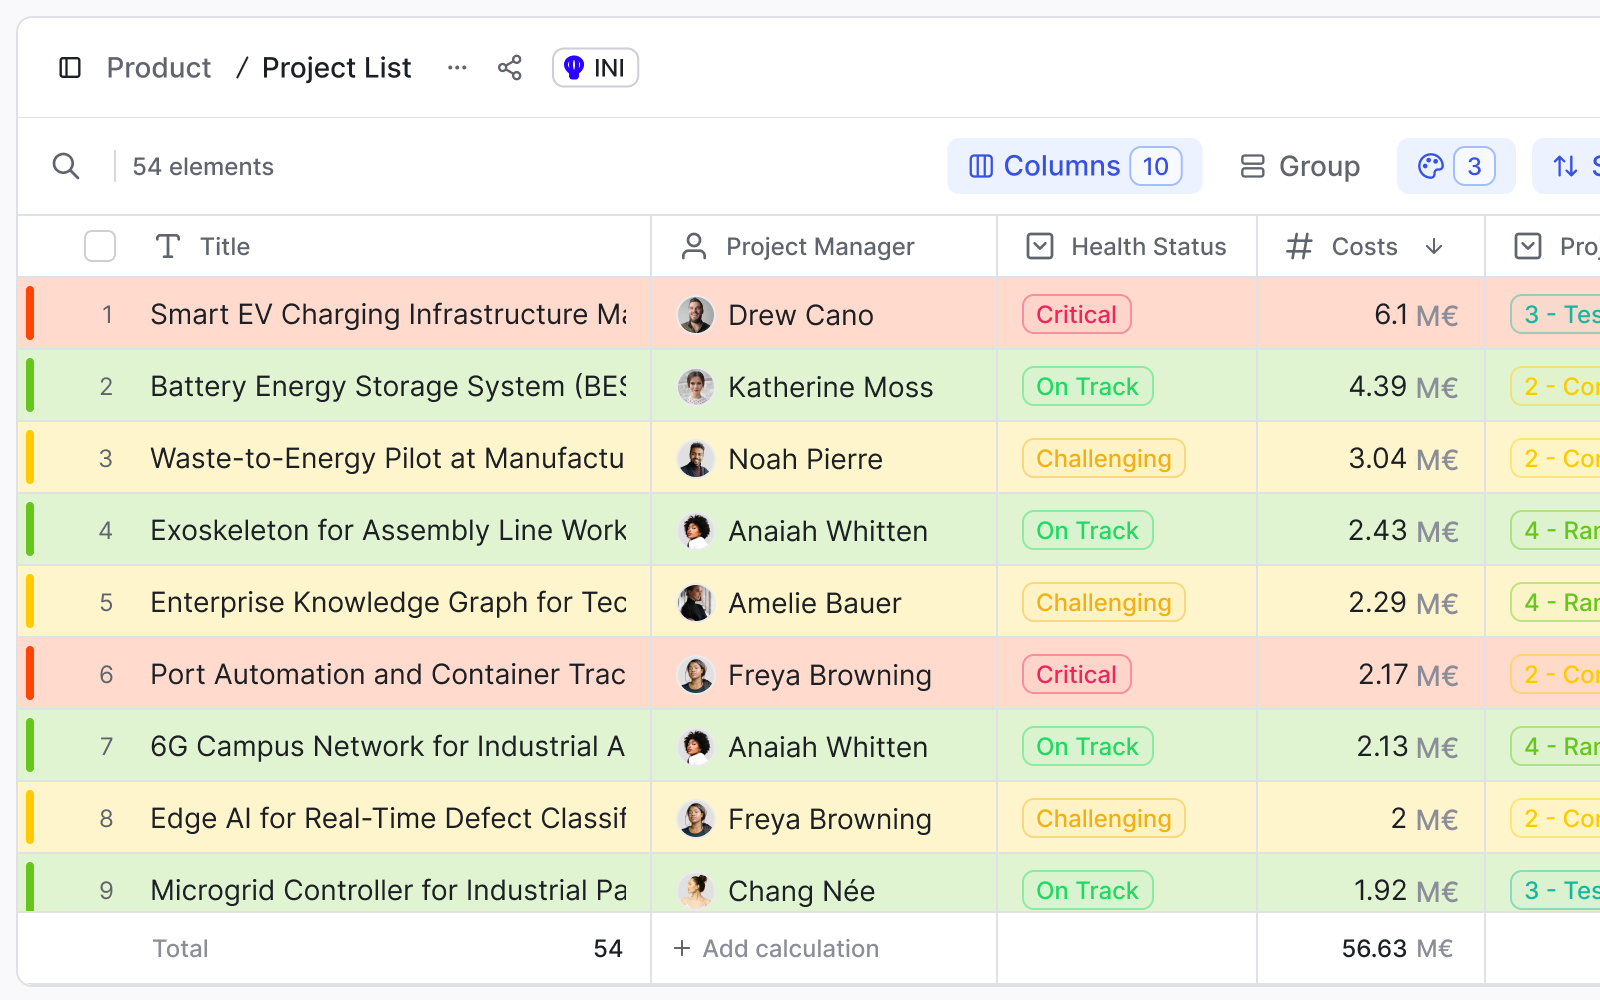
Exhibit 7: Project list with owners, costs, and status inside ITONICS