Sales numbers from last quarter were disappointing. Everyone waits for the momentum shift. The new product roadmap. When it arrives, more questions surface than confidence. Which of those initiatives will convince new customers?
The lead product manager points to the prioritization framework. Weighted scores exist. Prioritization criteria are documented. The product management process looks right on paper.
The prioritization process is followed rigorously right up until a critical trade-off requires a call. At that point, the product lead's judgment dominates. The prioritization method informed the easy decisions. It was bypassed for the ones that mattered. Technical pet projects overrule customer needs and business goals.
| Framework | Promise | Where it breaks | How to fix it |
|---|---|---|---|
| RICE (Reach, Impact, Confidence, Effort) | Brings structure and consistency to prioritization with quantifiable scoring | Scores become subjective and political; confidence = optimism, effort = what’s acceptable, not real; outputs look like data but act like advocacy | Use cross-functional, role-based scoring (not just product). Validate inputs with evidence. Apply anonymous scoring and calibration reviews to reduce bias |
| Value vs. Effort Matrix (implicit in RICE usage) | Simple visual prioritization: focus on high-value, low-effort wins | “Low effort” becomes a proxy for political feasibility rather than actual complexity; it depends entirely on honest inputs | Combine with engineering-led effort validation and historical accuracy tracking (compare estimated vs. actual effort) |
| MoSCoW (Must, Should, Could, Won’t) | Creates a shared language and speeds up prioritization decisions |
“Must Have” becomes politicized; everyone argues their initiative is essential; doesn’t resolve conflicts |
Add a conflict-resolution mechanism (e.g., scoring or governance layer). Define clear, measurable criteria for “Must” tied to customer impact or strategy |
| Kano Model | Anchors prioritization in customer satisfaction (basic, performance, excitement features) | Relies on fresh customer data; in slow-feedback environments, it reflects outdated needs | Implement horizon prioritization to overcome recency bias |
| Weighted Scoring Model | Transparent, auditable ranking across multiple criteria | Bias shifts to whoever sets the weights; it looks objective but encodes hidden agendas | Make weights explicit and cross-functional. Align weights to strategy each cycle. Introduce weight governance + periodic recalibration |
| Phase-Gate Process | Structured, evidence-based progression with checkpoints to stop bad projects early | Gates become rubber stamps for politically backed projects; documentation justifies pre-made decisions | Require cross-functional evidence at gates, track decision rationale vs. outcomes, and enforce accountability reviews for approvals |
Exhibit 1: Promises, challenges, and fixes for the most used product prioritization frameworks
This article covers:
- which prioritization frameworks large industrial organizations rely on and where each one breaks under pressure,
- how the project prioritization process fails at the moments of highest organizational tension,
- how to build a system where disagreement is visible, and overrides are accountable,
- and how to keep that system responsive as markets and business strategy shift.
The 5 most relevant product prioritization frameworks and their promises
Product managers trust frameworks to make project prioritization faster and more consistent. Scoring templates get completed. Prioritization criteria are documented. Stakeholders go through the strategic goals.
The prioritization framework holds until the first genuinely contested trade-off. Then the most senior voice in the room decides. Understanding where product prioritization frameworks break under organizational pressure explains why.
RICE scoring
RICE (Reach, Impact, Confidence, Effort) applies a consistent structure to the messy work of prioritizing projects. Product managers ask:
- Reach: how many customers does this initiative reach?
- Impact: What is the likely impact?
- Confidence: How confident is the team?
- Effort: What effort is required?
The structural weakness is that RICE is only as objective as the person filling in the numbers. When product managers score their own initiatives, confidence scores reflect optimism rather than evidence. Effort scores reflect what engineering will accept politically, not what the work actually requires. The rice method produces numbers that look like data but behave like advocacy.

Exhibit 2: RICE scoring framework explained
Teams comparing value vs effort quickly discover the same problem. In a value vs effort matrix, high-value, low-effort items float to the top.
Low effort scores become a proxy for political feasibility rather than actual development complexity. Not because the assessment was rigorous, but because the product team scores them that way. The value vs effort framing looks rational. It depends entirely on honest inputs. The final score looks objective. The inputs to prioritize product features were not.
MoSCoW method
The MoSCoW method creates a shared vocabulary for prioritizing projects: Must Have, Should Have, Could Have, Won't Have. In large corporations, it is a popular prioritization model for its speed and simplicity.
In practice, the Moscow method shifts conflict rather than resolves it.

Exhibit 3: The MoSCoW Model for product prioritization explained
Every business unit head argues their request belongs in the Must Have tier. Must have features become a political category. Project managers find themselves mediating between functions whose definition of "must have" reflects internal interests, not how many user needs them.
The debate moves from "which score is higher" to "whose definition of essential features applies". Teams using the MoSCoW method still need a process for resolving that disagreement. The MoSCoW method does not provide one.
Teams need a separate prioritization method for resolving Must Have conflicts.
Kano model
The Kano model connects project prioritization to customer satisfaction rather than internal preferences.
It classifies product features into three categories:
- Basic features are the minimum that customers expect. Their absence creates dissatisfaction, but their presence does not generate loyalty.
- Performance features improve customer satisfaction linearly as the product does more.
- Excitement features address customer needs they did not know they needed, but respond to strongly once they experience them.
For project selection and prioritizing features, the Kano model offers a useful lens. Prioritizing features that shift customer value from basic to performance to excitement creates a structured path toward meaningful differentiation. The Kano model makes prioritizing features a customer-anchored decision rather than an internal, technical feasibility one.
The assumption is that the product team has reliable, current customer feedback. In industrial goods markets, end-user feedback travels slowly. Field insights from key accounts can take 12 to 18 months to reach the product team through sales and distribution layers.
A Kano classification built on stale data guides the organization toward what customers expected 18 months ago, not what they need today.
The Kano model improves customer satisfaction when it is fed with current data. Without that, the Kano model is accurate about an outdated market. Pairing the Kano model with rolling customer feedback mechanisms addresses this directly.
Industrial goods companies that run quarterly customer needs reviews report meaningfully higher Kano classification accuracy.

Exhibit 4: Kano model explained for product prioritization
Weighted scoring model
Weighted scoring makes initiative ranking auditable. Each initiative is scored against multiple criteria. The weighted aggregate determines rank. Product managers, project managers, and business stakeholders can review the calculation.
The auditable surface conceals a control point. Whoever sets the weights controls the output.
A product lead who assigns 40% weight to "strategic alignment" and defines it as fit with the current product roadmap has not built an objective model for prioritizing features against strategic objectives. They have built a defensible one.
Distributing scoring across criteria does not eliminate bias. Each function defines value vs effort differently based on its own priorities. The business value vs complexity trade-off looks like a technical calculation but is a political one.
The effort matrix that emerges from cross-functional scoring reflects the relative importance each function assigned to its own priorities.
Phase-gate process
Phase-gate divides product development into sequential phases separated by formal checkpoints.
Each gate requires documented evidence of business value and project success potential before a project can advance. It is the dominant project prioritization framework in industrial manufacturing, applied across chemicals, aerospace, industrial equipment, and process industries.
Gate reviews are designed to stop wrong projects before they consume too much budget, and to channel limited resources toward initiatives with genuine project success potential.
Industrial goods companies increasingly use minimum viable products at early gates to test market assumptions before committing full engineering capacity. Teams preparing for each gate must provide development cost projections, resource availability assessments, and market validation. The structured process creates an evidence trail for the project portfolio that annual plans rarely produce.
In large organizations, gate reviews often become scheduled approvals. Senior sponsors who have already committed politically find that gate criteria will not stop their impactful projects. Cost estimates get adjusted. Market research gets reframed. The project management documentation justifies the predetermined outcome rather than informing it.
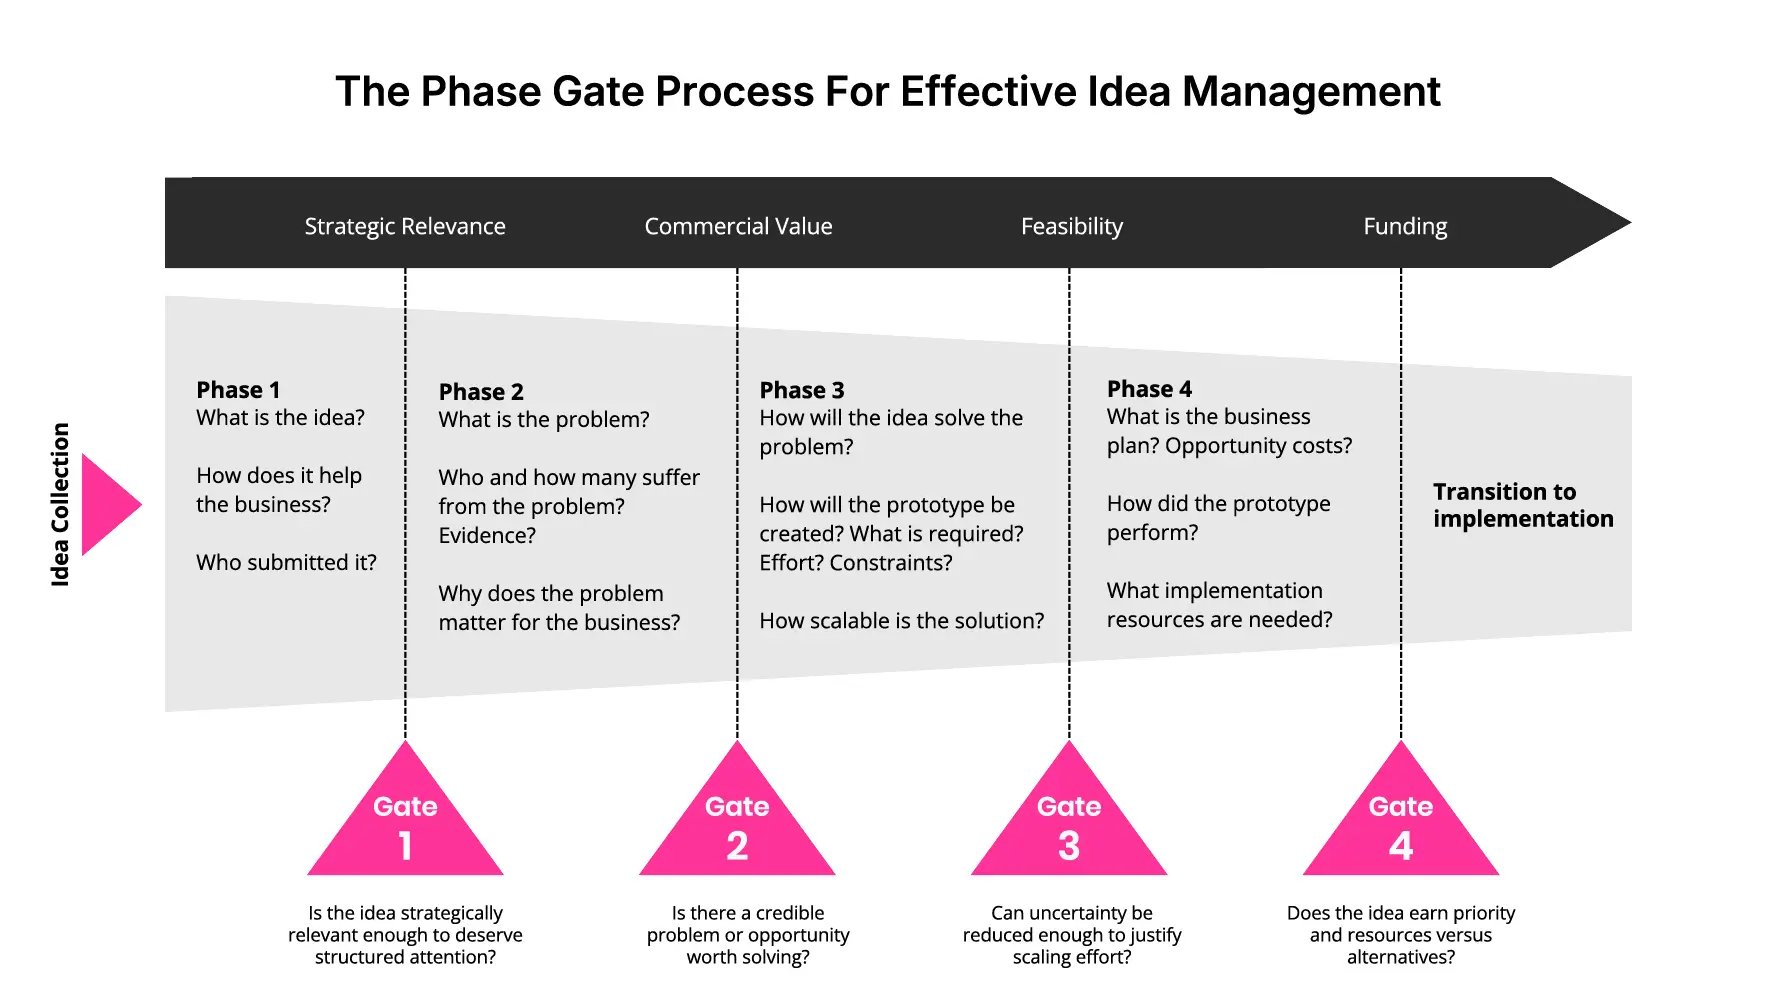
Exhibit 5: Phase-gate process for effective product idea management
What holds across all five prioritization models
The right prioritization framework for getting the most value from project and product portfolios matters less than most project managers assume.
Each produces defensible outputs when the surrounding process requires cross-functional inputs, surfaces disagreement before decisions finalize, and holds overrides accountable.
The companies extracting real value from phase-gate are not the ones with the strictest gate criteria. They are the ones bringing cross-functional evidence to each gate, documenting why major projects advance or stop, and reviewing that documentation against business outcomes.
Prioritizing projects well requires that business accountability is not limited to department-specific goals and interests, but keeps the strategic goals as the most important guiding indicators.
The ideal project prioritization process and where it breaks
Project prioritization breaks predictably. Not because of bad tools. It follows organizational gravity at three specific points.
When scoring reflects only one function
Product managers in large industrial companies score initiatives from within the product organization. The scoring accurately reflects product management priorities. It does not reflect what the rest of the business knows.
The VP of Sales carries information the product team lacks:
- Which accounts are quietly evaluating a competitor.
- Which regional markets have shifted in the past quarter.
- Which customer segments are growing faster than forecasted.
None of this enters the scoring process because sales has no seat at the table.
Project managers in engineering carry different knowledge:
- Which development platforms are approaching end of life.
- Where technical debt creates invisible risk.
- Which major projects share underlying components that could share resource allocation for a fraction of the combined cost.
- How limited resources are already committed across the development backlog.
Resource management constraints that are visible in the engineering backlog but invisible to product planning.
When project prioritization reflects only one function's view, the output looks consistent. It is a partial picture presented as a complete one.
When disagreement hides inside averaged scores
A product initiative scores 8.4 out of 10. The number looks authoritative. It hides a 5.2-point gap between business unit assessments.
The industrial automation division scored the initiative 9.8. Three of their accounts are waiting. The process industries division scored it 4.6. Their customers have not asked for it, and they would carry ongoing maintenance costs for a feature irrelevant to them.
The framework averaged both assessments and erased the signal. Because the disagreement was invisible, no resolution happened before the decision.
The conflict surfaces during product development. The automation division expects delivery in Q3. The process industries division challenges the scope that they never supported. The project misses its date.
Post-launch reviews attribute the failure to execution. The actual failure was in project prioritization: a known disagreement was never surfaced before resources were committed.
When overrides go unrecorded
A hydraulics initiative scores 6.1 and ranks 14th. The VP of the largest business unit, whose portfolio represents 40% of divisional revenue, requests that it be moved to third.
It moves to third. No documentation records which scoring criteria were set aside. No review is scheduled to assess whether the repositioning delivered the predicted result.
Within two cycles, the product development team stops investing effort in the scoring process. Prioritizing projects well requires trusting that scores shape decisions. When they demonstrably do not, the team stops building rigorous prioritization criteria.
The prioritization framework is maintained because process documentation requires it. No one believes it drives outcomes anymore.
Documented overrides reviewed against results change this behavior faster than any process policy change.
Building a mutually agreed project prioritization system
Shared ownership of the scoring process is what makes any project prioritization framework politically durable.
When functions contribute to scoring and see how their input shaped the output, they have a stake in the result. Disagreements surface before commitments are made. Overrides become less frequent because the output is trusted rather than gamed.
Five structural elements make project prioritization survive contact with organizational politics.
1. Role-based scoring before aggregation
Each function scores product initiatives against the criteria most relevant to their expertise, before seeing any other function's scores. Parallel scoring across functions converts the prioritization process from a product management exercise into a business decision.
- Engineering assesses development complexity and resource availability,
- Sales and support assess market demand and account-level urgency,
- Operations assesses manufacturability and scalability,
- Finance assesses capital requirements and revenue potential.
Each group works from the same scoring scale and the same evaluation criteria.
Parallel scoring prevents anchoring. When stakeholders see other functions' inputs before submitting their own, they adjust toward the perceived consensus.
/Still%20images/List%20Mockups%202025/capabilities-views-keep-it-public-or-not.webp?width=2160&height=1350&name=capabilities-views-keep-it-public-or-not.webp)
Exhibit 6: An evaluated idea list shared with other stakeholders
Scoring needs to capture each function's genuine assessment before social pressure shapes it. Managers who coordinate this process consistently report sharper scores in the first round when inputs are blind.
2. Weighted aggregation by expertise domain
Not all views on all criteria carry equal information. Engineering's assessment of resource capacity and project dependencies is more informed than sales'. Sales' assessment of customer value and business goals is more informed than engineering's.
Set explicit weights for each function on each criterion before scoring begins. For development risk and resource management, engineering carries 70% weight, product strategy 20%, finance 10%. For commercial potential and strategic alignment: sales at 60%, product strategy at 25%, finance at 15%.
Sharing these weights before the first prioritization cycle matters. When functions understand why their input carries more influence on some criteria, they score more carefully. Their assessments carry real weight. They know it.
3. Deviation flagging for hidden conflict
When one function scores an initiative 9/10 and another scores it 3/10, the six-point gap is a signal. Something important is unknown or misunderstood by at least one party.
Set a threshold: when the standard deviation across functional scores exceeds 2.5 points on a 10-point scale, flag the initiative for structured resolution before it enters the ranking.
A resolution session is not a debate.
It is a fact-finding exercise:
- Sales' 9.1 may be based on three active customer conversations engineering never heard about.
- Engineering's 3.4 may reflect a component sourcing constraint that sales was unaware of.
Surfacing these assumptions before the project prioritization framework produces a final ranking converts a political disagreement into a solvable technical one.
The resolution rarely requires a long meeting. It requires each function to make its reasoning explicit. Most impactful projects resolve within 30 minutes once the assumptions are visible.
4. Documented concern logs
Any function scoring more than three points below the median for a given initiative must document their reasoning before the scoring cycle closes.
Concern logs prevent reflexive low scores without substance. Low-scoring without reasoning is political behavior in reverse. It skews value vs effort assessments as surely as inflated scores do. They also protect the people raising legitimate objections. A process engineer who documents a manufacturability risk has a written record when the problem surfaces in production six months later. Large organizations lose this institutional knowledge constantly when dissent lives only in meeting memory.
When similar initiatives appear in the next portfolio review cycle, the documented concerns from the previous one are available. Teams stop repeating the same wrong projects when they can see why an earlier version was deprioritized.
/Still%20images/Workflow%20Builder%20Mockups%202025/capabilities-workflow-define-clear-approval-rules.webp?width=2160&height=1350&name=capabilities-workflow-define-clear-approval-rules.webp)
Exhibit 7: Workflow with decision gate configuration
5. Public override protocol
Portfolio sponsors retain authority to override project prioritization outputs. They carry accountability for business results and sometimes hold customer feedback or strategic context that did not make it into the scoring process. That authority is legitimate, particularly for decisions with significant strategic impact on the broader business unit.
Every override must record: which initiative is being elevated or deprioritized, which prioritization criteria the decision supersedes, what specific business rationale justifies the change, and what outcome metric will be reviewed at the 90-day mark.
Quarterly governance reviews compare override decisions to stated rationale. When sponsors know their overrides will be assessed against business objectives and results, the casual override driven by relationship or habit becomes much rarer. Teams prioritizing projects with visible override accountability report significantly fewer political reversals after the first cycle of documented reviews.
Maintaining a project prioritization system that adapts to change
A project prioritization framework calibrated to last year's strategic goals will optimize for conditions that no longer exist. Industrial goods markets move faster than annual planning cycles anticipate. External factors change the competitive context. Business objectives change when a major account shifts behavior. A tier-one supplier announces a platform discontinuation.
The product portfolio management process needs mechanisms to absorb these signals without abandoning the structure that makes it credible.
Trigger-based out-of-cycle reviews
Connect the market to your product roadmap decisions. When a direct competitor launches a product addressing your core market, you need to know directly and cannot wait for the next planning meeting.
When an external event happens, you should have a system that informs you about it. And, it should inform you about its direct impact on product initiatives.
Full-portfolio rescoring at every market signal creates organizational fatigue that kills project prioritization discipline. Automated information triggers keeps the prioritization model responsive without treating every quarter as a new planning cycle.
This is how the right prioritization framework stays right. Not by choosing a more sophisticated model but by building the AI governance to update it when the world changes.

Exhibit 8: ITONICS AI assistant flags off-strategy projects
Rolling horizon scoring
Product development cycles in industrial manufacturing run 18 to 36 months. Prioritizing projects against current conditions is structurally misleading. The organization delivers a product into a market that will look materially different from today.
Effective resource allocation across a 3-to-5 year product horizon requires scoring against forward-looking signals. Score product initiatives against the 3 different horizons (the 70:20:10 model).
Patent filing activity in your technology domain. Customer capital expenditure announcements. Raw material price trajectories. Procurement shifts at key accounts.
A "high commercial potential" score should require that the customer value proposition is defensible 24 months from now. Building this forward requirement into the scoring scale definition changes what product managers research before scoring, not just how they score.
Customers expect more from industrial equipment suppliers than they did five years ago. Product-led growth in this sector increasingly depends on anticipating those expectations before they become explicit requests. Rolling horizon scoring is how project prioritization keeps pace with that shift.
Weight recalibration at each planning cycle
The weights assigned in the scoring model encode the organization's strategic focus. When strategy changes, the weights must follow.
When business objectives shift and product strategy moves toward a new industrial segment, customer satisfaction data from that segment should carry more weight in commercial scoring. When the organization enters a margin improvement phase, resource optimization and manufacturing efficiency should carry more weight in feasibility scoring.
Weights that stay fixed while strategy changes cause the project prioritization framework to optimize quietly for abandoned objectives. The effort matrix shifts as engineering capacity changes. The weighting should shift with it. Review and recalibrate at the opening of each product portfolio management cycle, anchoring new weights to key objectives agreed at the strategy level.
Cross-functional calibration documentation
An always accessible system of record closes the feedback loop most large organizations leave open.
Which major projects delivered what the framework predicted? Where did engineering estimates prove optimistic? Where did sales overestimate addressable demand for specific product features?
Each gap is a calibration input for the next decision.
Which initiatives scored as low effort actually required significantly more? Where did low-effort assumptions collapse once work began? Which high-value predictions proved accurate?
Without this flagging and knowledge, scoring bias compounds. The same functions systematically overestimate or underestimate across cycles. Project management accuracy degrades without anyone correcting for it because no one has looked at the pattern.
Did the product reach the customer segments the scoring predicted? How did the final score compare to market outcomes? These questions deserve an accessible history that a strategic portfolio AI can deliver.
Keep market, strategy, and project prioritization in sync with ITONICS
ITONICS provides the infrastructure for product portfolio management at hardware scale.
/Still%20images/Roadmap%20Mockups%202025/portfolio-link-projects-teams-and-milestones-2025.webp?width=2160&height=1350&name=portfolio-link-projects-teams-and-milestones-2025.webp)
Exhibit 9: Projects, owners and dependencies shown on one roadmap
Each function scores initiatives through role-based access. No function sees another's inputs until the scoring window closes. Weighted aggregation applies automatically. Deviation flags surface in real time and trigger structured resolution workflows before initiatives enter the final prioritization ranking.
Override documentation is embedded in the decision workflow. When a portfolio sponsor moves an initiative outside the scoring output, the system requires a structured rationale tied to specific strategic objectives and significant benefits. Reports are always up-to-date, surfacing the comparison between override predictions and actual results.
ITONICS connects any prioritization framework to live market intelligence. Trend monitoring, technology tracking, and competitive signals feed directly into the scoring environment. When a market development changes the assumptions behind a prioritization criterion, product managers and project managers see the updated context within the system where scoring happens, not in a separate research process consulted too late.
For large industrial organizations managing project and product portfolios across multiple business units, geographies, and development timelines, ITONICS visualizes the full product tree alongside scoring data. That connection between market intelligence and portfolio decisions is what keeps strategic alignment intact as conditions evolve.