Technology leaders face a growing mismatch. The pace of technological change keeps accelerating, but shared understanding inside organizations does not. This is Martec's law.
 Exhibit 1: Martec's law
New technologies emerge faster than teams can assess, contextualize, and act on them. Artificial intelligence, cloud infrastructure, and software systems evolve in parallel. Each brings opportunity. Each brings risk. Few organizations maintain a clear, current view of what matters and why.
Technology reporting exists to close this gap. Not by producing more reports, but by turning technology data into insight that supports strategy, investment, and execution. When done well, it scales tech fluency across leadership teams. When done poorly, it creates noise and false confidence.
This article explains what scaling tech fluency actually requires. It outlines seven essential technology reporting tools that technology managers use to support decision-making at scale. Each tool solves a specific problem. Together, they form a system that connects technology trends to business strategy.
The costs of not closing the tech fluency gap
Low tech fluency has direct operational and strategic costs.
When leadership teams lack a shared understanding of technology, decisions slow down. Discussions become reactive. Investment debates focus on opinions instead of evidence. Opportunities are either overestimated or dismissed too early.
-
One cost is misallocated investment. Organizations fund technologies that feel urgent rather than those with real potential impact. At the same time, critical developments are missed because they sit outside existing mental models. This leads to fragmented portfolios and weak returns on innovation spending.
-
Another cost is execution risk. Teams move forward with projects without aligning on assumptions about maturity, integration effort, or scalability. Problems surface late. Rework increases. Timelines slip. Confidence in technology teams erodes.
-
There is also a strategic cost. Companies struggle to connect technology trends to long-term business strategy. Technology reports describe what is new, but not what it enables. As a result, strategy discussions remain abstract and disconnected from reality.
-
The tech fluency gap also affects leadership alignment. Executives interpret the same technology report in different ways. Decisions depend on who speaks most confidently, not on shared knowledge. Over time, this undermines trust in reporting processes.
Finally, the cost compounds over time. As technologies evolve, outdated assumptions persist. Organizations respond too slowly to change, even when data is available. In fast-moving industries, this delay alone can erase competitive advantage.
Closing the tech fluency gap is therefore not about education. It is about creating systems that continuously translate technology developments into clear, comparable, decision-ready insight.
What scaling tech fluency actually means
Tech fluency is often misunderstood. It is not about making everyone a technical expert. It is about enabling leaders to make sound decisions about technology with confidence.
Scaling tech fluency means generating a shared, repeatable understanding of how technologies affect the company. That understanding must hold across teams, functions, and seniority levels. It must also update as technologies evolve. At best, technology reports provide varying levels of detail for different audiences, such as engineers and managers.
At a practical level, tech fluency has three components.
.webp?width=1920&height=1080&name=2025.07_Blog%20Image%20Library%20(5).webp)
Exhibit 2: The three components of technology fluency
First, awareness. Leaders need a current view of relevant technology trends and emerging technologies. This includes understanding where technologies sit in their development and adoption lifecycle. Without this baseline, discussions default to hype or fear.
Second, context. Technology insight only matters when it is connected to business strategy. Leaders must understand how a new technology could affect costs, efficiency, infrastructure, or competitive position. This requires framing technology developments in terms of potential impact, not technical novelty.
Third, comparability. Decision-making breaks down when technologies are discussed in isolation. Scaling tech fluency requires structured ways to compare options across consistent criteria. This allows teams to debate trade-offs instead of arguing over definitions.
Technology reporting is the mechanism that brings these components together. It translates raw data, research, and analysis into formats that leaders can absorb and use. It generates a common language for discussing technology across the enterprise.
Importantly, tech fluency does not scale through one-off reports or annual reviews. It scales through continuous accessibility. Constant tech reporting must support continuous updates, shared access to knowledge, and alignment between tech groups and executives.
Technology managers should emphasize accuracy, relevance, and actionability in all reporting activities to ensure effective communication of technology insights.
This is why tooling matters. Not because techniques replace judgment, but because they make judgment repeatable. The seven technology reporting tools outlined next each address a specific breakdown point in tech fluency. Used together, they help enterprises move from fragmented insight to informed, coordinated action.
The 7 essential technology reporting tools
Technology reporting only scales when techniques are designed as a system. Single artifacts do not create tech fluency. They create snapshots.
Organizations that rely on a yearly technology report struggle to keep pace with change. Data ages quickly. Assumptions persist. Decisions are made on outdated context.
The seven technology reporting tools outlined here address this problem directly. Each technique solves a different breakdown in how organizations understand technology. Together, they create a reporting system that supports awareness, analysis, and action.
Some tools help groups scan tech trends. Others structure comparison and prioritization. Others translate insights into decisions for executives. All of them are required to scale tech fluency across large organizations.
Tool 1: Technology radars for shared awareness
Technology radars solve an awareness problem.
As technology trends multiply, teams lose sight of what matters. Emerging technologies, technological advancements, and new technology signals compete for attention. Without structure, discussions default to hype or personal bias.
A technology radar provides a shared view of the technology landscape. It shows which technologies are relevant, how mature they are, and how their expected impact may evolve. This creates a common starting point for discussion.

Exhibit 3: A technology radar providing a shared view of the biotech landscape
For technology managers, radars reduce noise. They focus attention on a defined set of technologies instead of an unfiltered stream of data. This is critical in organizations operating at a large scale, where teams face constant input from vendors, research, and media.
Effective technology radars are not static visuals. They are living tools. They evolve as data changes, research deepens, and technologies move from exploration to adoption. When radars are updated continuously, they support ongoing alignment across teams.
Radars also support cross-functional communication. Executives do not need deep technical detail. They need clarity. A well-designed radar translates complex technology systems into an accessible view that supports strategic discussion.
Without technology radars, organizations rely on fragmented awareness. Teams track different technology trends. Leaders receive inconsistent signals. Tech fluency breaks down before decisions even begin.
Tool 2: Technology roadmaps for timing and sequencing
Technology radars show what matters. Technology roadmaps show when and how to act.
Roadmaps address a different failure in technology reporting. Many organizations understand emerging technologies but struggle to sequence action. Investments happen too early or too late. Dependencies are overlooked. Integration costs are underestimated.
A technology roadmap connects technology trends to time. It links development, adoption, and integration steps to business strategy and infrastructure planning. This makes trade-offs visible.
For technology managers, roadmaps provide structure. They clarify which technologies require immediate development, which should be monitored, and which belong in the future. This supports realistic planning and resource allocation.
Roadmaps are especially important in environments with complex systems and long investment cycles. Infrastructure, platforms, and core technology components cannot be replaced overnight. Sequencing matters.
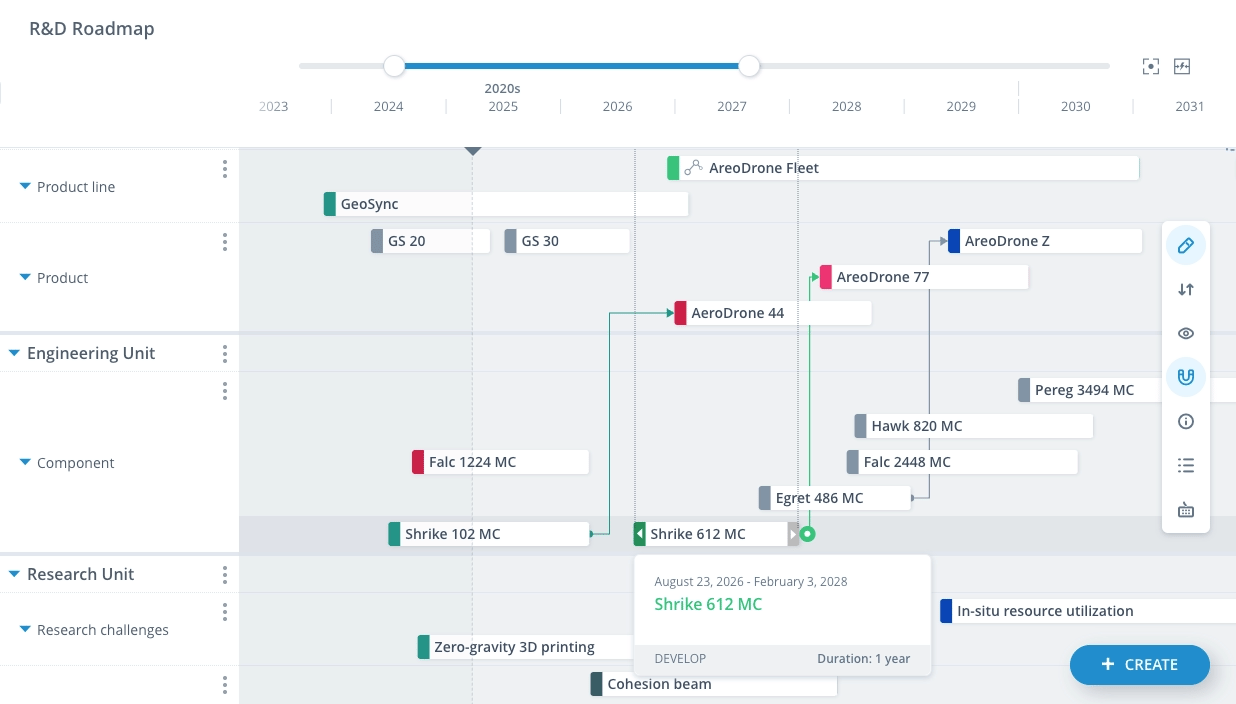
Exhibit 4: An R&D roadmap showing how product lines, engineering units, and research units collaborate
Effective roadmaps are not rigid plans. They are adaptive frameworks. As data evolves and assumptions change, the roadmap evolves with it. This allows organizations to respond to technological advancements without losing strategic coherence.
Without technology roadmaps, organizations react to trends instead of shaping them. Projects start without alignment. Teams pull in different directions. The cost of poor sequencing shows up in delayed projects, integration failures, and wasted investment.
Tool 3: Technology application matrix for structured comparison
Technology decisions fail when comparison is informal.
Teams often discuss technologies one by one. Each conversation uses different criteria. Impact, effort, and risk blur together. Decisions become inconsistent and hard to defend.
A technology application matrix introduces structure. It allows organizations to compare technologies across defined dimensions such as potential impact, feasibility, integration effort, or strategic relevance. This creates a shared analytical frame.
For technology managers, matrices reduce ambiguity. They force explicit assumptions. They make trade-offs visible. This shifts discussions from opinions to analysis.
The value of a matrix is not precision. It is comparability. Quantitative measures provide orientation, not certainty. When used correctly, matrices support better judgment rather than replacing it.
Matrices also support portfolio-level thinking. Instead of evaluating projects in isolation, organizations can see how technologies cluster across use cases, systems, or business units. This improves investment decisions and reduces duplication.
Without structured comparison, organizations overinvest in familiar technology and underestimate emerging options. The technology application matrix creates discipline where intuition alone is not sufficient.
Tool 4: R&D dashboards for continuous visibility
Static reporting cannot keep pace with technological change.

Exhibit 5: An R&D dashboard showing all R&D performance indicators
R&D dashboards address a visibility problem. They provide a current view of technology development, projects, and performance across teams and systems. This visibility is critical in large organizations.
Dashboards aggregate data from multiple sources. They track progress, dependencies, and key metrics in one place. This supports faster decision-making and reduces reliance on manual status updates.
For technology managers, dashboards enable continuous oversight. They reveal where development is on track and where intervention is needed. This improves efficiency and reduces late-stage surprises.
Dashboards also support alignment between teams and executives. Leaders gain access to consistent information without waiting for a formal report. This builds trust in the reporting process.
Effective dashboards focus on relevance. They avoid overload. Each metric exists to support a decision or highlight risk. When dashboards become collections of unrelated indicators, they lose value.
Without continuous visibility, organizations manage technology reactively. Issues surface late. Coordination breaks down. R&D dashboards provide the operational backbone for scalable technology reporting.
Tool 5: Agentic AI signal repositories for early detection
Early signals rarely announce themselves clearly.
Agentic AI signal repositories address a detection problem. They help organizations identify emerging technologies, weak signals, and early indicators before they reach mainstream awareness.
These repositories collect signals from diverse sources such as research, patents, startups, and market activity. Agentic AI systems assist by scanning, clustering, and updating data continuously.
/Still%20images/AI%20Mockups%202025/foresight-discover-new-insights-2025.webp?width=2160&height=1350&name=foresight-discover-new-insights-2025.webp)
Exhibit 6: An AI agent reporting relevant digitalization trends
For technology managers, this reduces blind spots. It expands the field of view beyond familiar industries and existing technology stacks. Early detection supports proactive exploration instead of reactive response.
The value lies in structure, not volume. Signal repositories must connect raw data to context. Signals are tagged, linked, and evaluated based on relevance and potential impact.
Agentic AI supports scale. It handles large volumes of data that human teams cannot process manually. This allows organizations to maintain awareness without overwhelming teams.
Without structured signal repositories, organizations depend on ad hoc research and external reports. By the time technologies appear on the radar, the window for advantage may already be closing.
Tool 6: Narrative PowerPoint reports for executive decision-making
Executives do not make decisions from raw data. They decide through narrative.
PowerPoint reports translate complex technology analysis into a format that leadership can absorb quickly. They connect data, context, and implications into a clear line of reasoning. This is critical in enterprises where decisions span multiple systems and teams.
A strong technology report does not list findings. It explains what has changed, why it matters, and what options exist. The narrative frames the evolution of technologies over time and highlights the aspects that require action.
For management teams, narrative reports create alignment. They ensure that executives consistently interpret technology insights. This reduces miscommunication and speeds up decision-making at scale.
These reports also support accountability. Assumptions are defined. Trade-offs are explicit. Decisions can be traced back to the information available at the time. This is essential when reviewing outcomes in a later year’s report.
An effective narrative report balances clarity and depth. It avoids technical overload while preserving critical detail. The goal is not simplification. The goal is focus.
Without narrative reporting, even well-developed analysis fails to influence strategy. Insights remain trapped in tools and dashboards. Decisions revert to intuition. PowerPoint, when used deliberately, remains one of the most efficient techniques for executive technology reporting.
Tool 7: Artificial intelligence alerting systems for new tech trends
Artificial intelligence alerting systems address a speed problem. They monitor new technology signals and notify teams when meaningful change occurs. This is essential in environments shaped by the rapid pace of technological evolution.
Unlike static monitoring, AI alerting systems are designed to detect shifts across data sources. They surface new tech trends, emerging technologies, and other tech trends as they develop. This supports timely awareness.
For enterprises, alerting systems reduce reliance on periodic research efforts. Teams no longer wait for a yearly report to learn what has changed. Instead, relevant updates reach the right people as they happen.
These systems are most effective when alerts are curated. Not every signal deserves attention. Defined thresholds and relevance criteria ensure that alerts support decision-making rather than create noise.
AI alerting also improves efficiency. It automates scanning and filtering tasks that would otherwise require significant manual effort. This allows teams to focus on analysis, interpretation, and action.
/Still%20images/Element%20Mockups%202025/portfolio-receive-risk-alerts-2025.webp?width=2160&height=1350&name=portfolio-receive-risk-alerts-2025.webp)
Exhibit 7: An AI agent detecting and reporting an increase in autonomous networks
An example of failure is easy to spot. Organizations that track trends manually often notice change only after competitors act. Alerting systems shift the balance from reaction to anticipation.
Without intelligent alerting, technology reporting lags behind reality. With it, organizations build the skills needed to respond early, allocate resources wisely, and stay aligned as technology continues to evolve.
The Intel case study: How to connect technology insights and strategy-making
Intel shows how technology reporting becomes strategic when it is continuous, structured, and embedded in decision-making.
Its Corporate Foresight Program was developed to track emerging technologies, interpret their relevance, and translate insights into guidance for leadership teams. The focus is not on producing a yearly report, but on maintaining ongoing awareness and alignment with strategy cycles.
Intel’s technology reporting activities include:
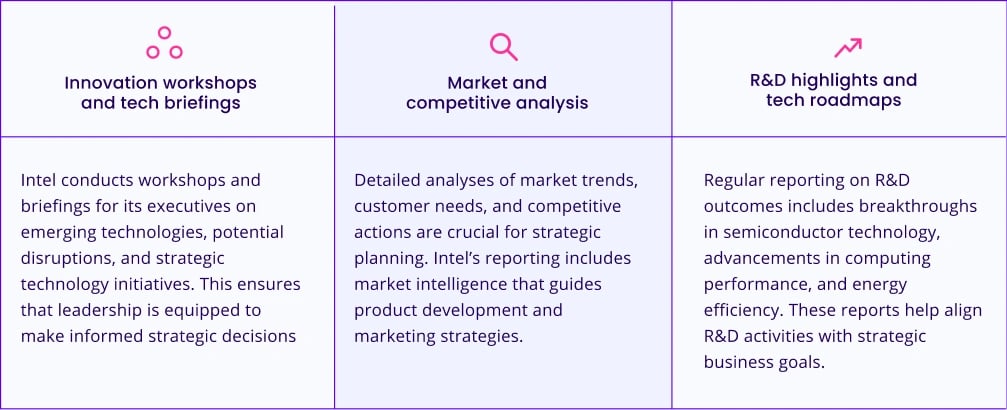
Exhibit 8: Intel's technology reporting activities
Intel’s ongoing success and leadership in the semiconductor industry underscore the value of integrating technology analysis and reporting into strategic decision-making processes. Intel's approach ensures that its executives are well-informed and capable of steering the company through the complexities of technological evolution and market dynamics.
Technology reporting impacts several strategic decisions at Intel, including:
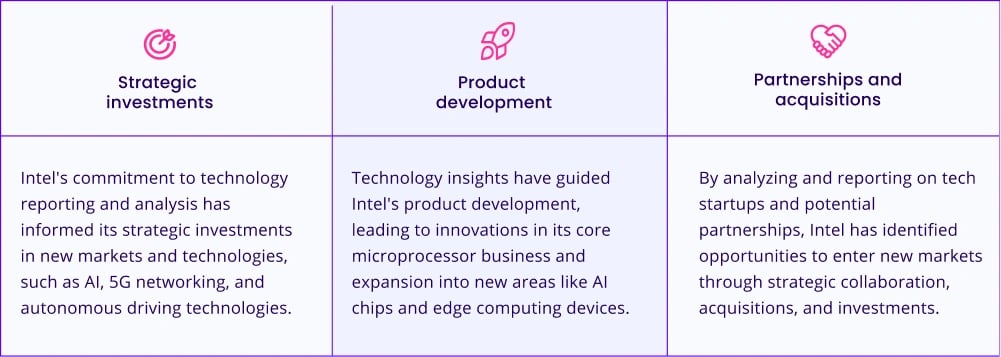
Exhibit 9: What strategic decisions Intel's technology reporting activities impact
A core strength of the program is its internal contributor network. Experts from different domains continuously gather and interpret signals together. This prevents siloed thinking and improves the quality of insight across the organization.
Interpretation is as important as detection. Signals are discussed, evaluated, and connected to potential impact through regular forums. This ensures that raw data evolves into shared understanding rather than isolated analysis.
Executive involvement is critical. Technology insights are discussed directly with decision-makers and linked to resource allocation and long-term planning. This keeps technology reporting close to strategy rather than buried in research teams.
Intel’s approach shows that tech fluency scales when reporting is treated as a living system. Insights gain value when they are interpreted collaboratively, refreshed continuously, and connected to defined decision processes.
Start to act on technology trends with ITONICS
Technology reporting only generates value when it leads to action.
ITONICS helps companies turn tech trends, signals, and analysis into decision-ready insight. It brings all reporting techniques together in one platform. From technology radars and roadmaps to dashboards, signal repositories, and management reports.
Technology managers use ITONICS to gain a shared view of emerging technologies, track their evolution, and connect insights directly to strategy and portfolio decisions. Reporting stays current. Assumptions are visible. Decisions are grounded in evidence.
Instead of producing isolated reports, companies build a continuous technology reporting system that scales with complexity. This is how companies close the tech fluency gap and move from observing trends to shaping outcomes.