In the dynamic landscape of strategic foresight, staying ahead requires not just tracking signals but understanding their evolution over time.
Understanding the trajectory of signals is crucial for informed decision-making. It provides a deeper perspective on emerging trends, technologies, and potential disruptions, empowering your organization to respond proactively.
Foresight software functions as your AI-driven monitoring ally, facilitating the tracking of developments. Beyond merely collecting data, monitoring signal evolution entails spotting anomalies, seizing early warning indicators, and transforming insights into strategic assets. Let's explore how to execute this effectively.
1. Identifying signals for trend and tech monitoring
In the dynamic landscape of today's business environment, the sheer volume of data can be overwhelming. The initial challenge lies in identifying the specific signals that are most relevant to your organization's objectives. This involves a strategic process of selecting key areas of interest, such as emerging technologies, market trends, opportunities, risks, or startups. The focus should then be on signals directly impacting your areas of interest. Establishing specific areas of interest for signal monitoring lays the groundwork for a focused and efficient monitoring strategy.
How to accelerate weak signal detection →
2. Organizing information
After identifying the areas of interest for signal monitoring, the next crucial step is to systematically organize this information. This organization is essential for efficient retrieval and analysis. Establish a structured framework that categorizes signals based on their nature and relevance. This could involve creating databases, repositories, or digital dashboards that serve as centralized hubs for signal tracking. The goal is to ensure the information is easily accessible and comprehensible for stakeholders involved in the monitoring process.
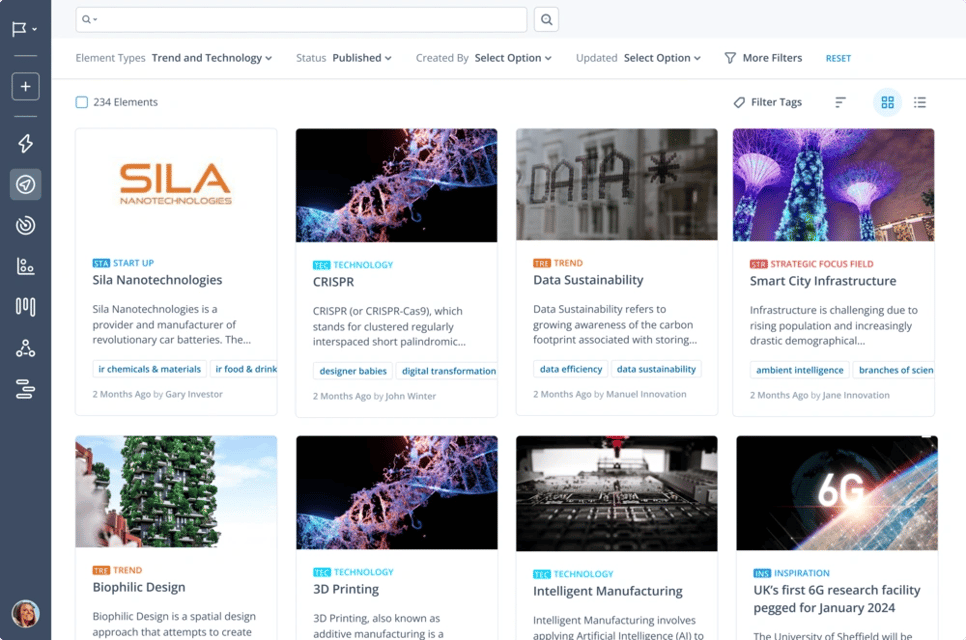
Here, we have systematically structured the information we aim to monitor into distinct categories such as trends, technologies, strategic focus fields, inspirations, and startups. This structured approach enables us to create specific fields or properties tailored to each category. It also provides clarity on the relationships between signals and the corresponding information.
As an illustration, suppose our focus is on monitoring signals and developments in the technological domain of Green Hydrogen. This structure allows us to precisely identify and track the signals related to this area of interest and easily pinpoint what’s important for us to focus on.

/How-to-Monitor-Signal-Evolution-in-Key-Interest-Areas-update-1.webp?width=864&height=773&name=How-to-Monitor-Signal-Evolution-in-Key-Interest-Areas-update-1.webp)
3. Building a chronological development timeline
Establishing a chronological development timeline of signal changes enables you to quickly understand significant changes. This timeline should highlight key events, shifts, or anomalies associated with the monitored signals. You can use simple spreadsheets to build your timeline creating a structured system to capture, organize, and analyze data.
However, by leveraging tech and trend monitoring tools powered by machine learning and artificial intelligence, you can automate aspects of the monitoring and analysis processes. Machine-learning tools can identify patterns, anomalies, and correlations within the data, providing valuable insights that may not be immediately apparent through manual analysis. Integrating these technologies into the monitoring system enhances efficiency and allows for more proactive decision-making.
4. How to automate monitoring signals over time
The automated tracking of signal changes over time empowers you to swiftly handle vast data volumes, providing a contextualized understanding of these changes free from human bias and with enhanced efficiency. To illustrate, consider the tracking of signal evolution over time in our focus area, Green Hydrogen.
/How-to-Monitor-Signal-Evolution-in-Key-Interest-Areas-update-2.webp?width=831&height=769&name=How-to-Monitor-Signal-Evolution-in-Key-Interest-Areas-update-2.webp)
/How-to-Monitor-Signal-Evolution-in-Key-Interest-Areas-update-3.webp?width=829&height=767&name=How-to-Monitor-Signal-Evolution-in-Key-Interest-Areas-update-3.webp)
Here, we’ve leveraged signals alerting to display a dynamic timeline showcasing the evolution of signals pertaining to Green Hydrogen. Tailor your view by filtering signals based on their source type and timeline. The system highlights key events on the timeline, enabling you to promptly recognize patterns indicative of significant changes.
Save your tailored view with specific source types and timeframes for an easy revisit and quick identification of any recent significant changes. Additionally, you can opt to 'Watch' your area of interest, prompting the system to send you email notifications whenever a key event occurs.
Key events include sudden spikes or declines in the number of signals over a specific period of time, as well as sustained spikes or declines in interest over time.
A growth spike occurs when there's a sudden surge in interest within a timeframe shorter than one month, causing an upward trend in the element.
Conversely, a decline spike happens when there's a sudden drop in interest within a timeframe shorter than one month, resulting in a downward trend in the element.
A sustained growth is indicated as a key event in the system when there is a prolonged period of interest lasting longer than a month.
On the other hand, a sustained decline is triggered as a key event on the system when there is an enduring lack of interest spanning longer than a month.
For any key events that indicate sudden or sustained growth spikes within news sources, the ITONICS system also provides aggregated information clusters to help you quickly understand spikes in interest. Each cluster includes AI-generated titles and summaries for swift comprehension and you can easily dive deeper into intriguing clusters by exploring individual news articles. Found something worth exploring? Save it for future monitoring and evaluation with ease.
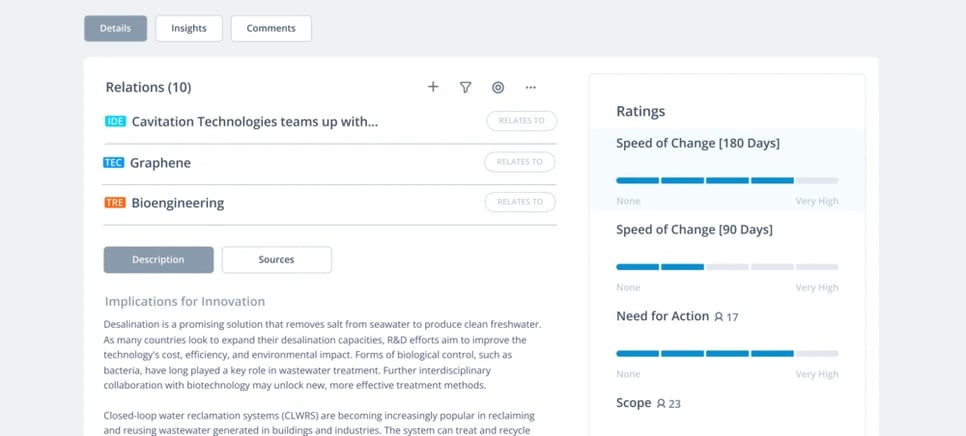
In addition to utilizing automated monitoring in ITONICS, leverage the power of smart scoring—an automated system designed to provide insights into the evolution of signals related to a specific area of focus. These scores, known as Speed of Change, are calculated over periods of 90 or 180 days. The system intelligently consolidates signals from news, patent data, and scientific publications, assigning scores such as Very Low, Low, Medium, High, or Very High based on the nature and importance of the changes.
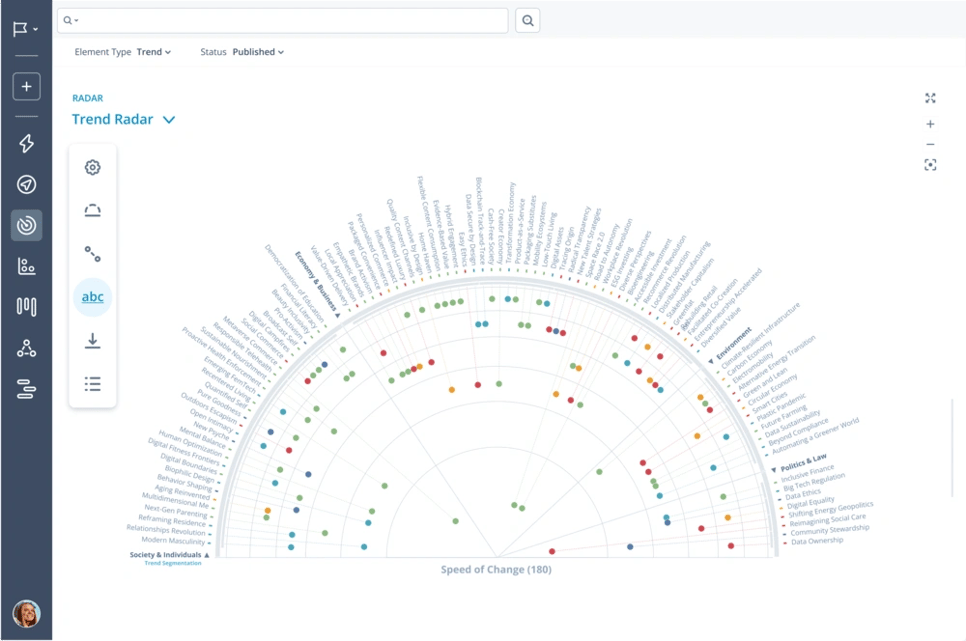
Customize your Radar view according to the Speed of Change scores to swiftly pinpoint areas with the most significant developments over 90 or 180 days. This feature helps you spot potential mismatches between your internally defined urgency or timeline, and actual events in the external environment. It helps you streamline your decision-making process by eliminating the need for manual monitoring of changes.


Establishing continuous review mechanisms for better decision-making
The trend and tech monitoring process should not be a one-time setup but rather a continuous and iterative practice. Establish mechanisms for regular reviews and updates to ensure that the monitored signals remain aligned with the evolving business landscape. Continuous review allows you to adapt swiftly to emerging trends, mitigate risks, and capitalize on new opportunities.
In conclusion, effective monitoring of signals involves a strategic approach, from the identification of relevant signals to the continuous enrichment and analysis of data. Organizing information, building chronological timelines, leveraging advanced technologies, and establishing continuous review mechanisms are integral components of a robust signal monitoring system. As organizations navigate the complexities of their industries, a well-designed monitoring strategy becomes a key enabler for informed decision-making and proactive adaptation to the ever-changing business environment.
FAQs
- How can the strategies for monitoring signal evolution be adapted for use across different industries, especially those with unique or rapidly changing environments?
The strategies for monitoring signal evolution can be tailored to different industries by adjusting the parameters and focus areas to match industry-specific trends and challenges, ensuring the monitoring process remains relevant and effective across various sectors.
- How can organizations assess the impact of identified signal evolutions on their strategic decisions and business outcomes?
Organizations can assess the impact of signal evolutions on strategic decisions by linking changes in signals to shifts in market dynamics, customer behavior, or competitive landscapes, helping to quantify the influence of these evolutions on business outcomes.
- How can the tools and techniques for monitoring signal evolution be integrated with existing organizational systems, such as market research or competitive intelligence tools?
Integrating signal evolution monitoring tools with existing systems involves aligning data inputs and outputs, ensuring compatibility, and possibly using APIs or custom integration solutions to streamline data flow and analysis across different platforms.


/How-to-Use-Environmental-Scanning-in-Your-Innovation-Journey-fullwidth.webp??&width=900&height=450&name=How-to-Use-Environmental-Scanning-in-Your-Innovation-Journey-fullwidth.webp)