


Managing your innovation portfolio demands precision, especially when it comes to financial data.
Understanding key financial portfolio metrics is crucial for the ongoing success of your innovation efforts. Managing an innovation portfolio involves handling budgets, keeping a close eye on spending, and making intelligent decisions based on financial insights. A key component of effective strategic portfolio management is understanding your financial situation fully. With many projects happening simultaneously, it's important to have a robust system in place to easily monitor and compare how well you're doing financially. Let's take a look at how to do this.
Centralize your financial data
Centralizing all financial data for innovation projects offers real-time spending monitoring in dynamic environments, enhancing swift decision-making. It minimizes errors associated with managing finances across varied platforms, ensuring consistent and accurate reporting. Resource allocation becomes streamlined with a quick-access, centralized view, aiding effective comparison of financial performance across projects or periods. This facilitates the assessment of innovation initiative success and informs future strategy refinement.
Decision-makers can optimize spending, identify underutilized resources, and strategically allocate budgets. A centralized financial overview supports effective risk management, enabling early identification and proactive mitigation of potential financial risks.
ITONICS Lists for comparative analysis for informed decision-making
Eliminate the need to tediously switch between spreadsheets and documents with ITONICS Lists. Lists provide a view of all your innovation projects and programs in one glance.
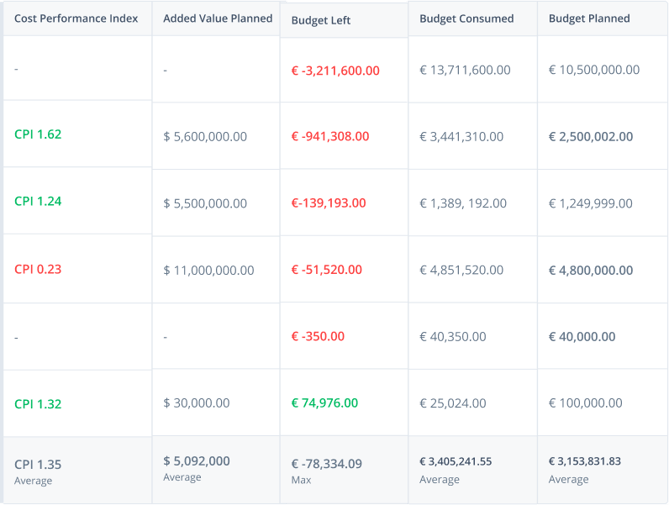
Configure the list to show all the financial data you want to see or report on. For example, display Budget Planned, Consumed, and Budget Left to quickly understand the following:
- Budget Planned to understand how high your overall investment will be.
- Budget Consumed to understand the current portfolio landscape.
- Budget Left to quickly grasp whether your budget allocation is on track or severely off track.
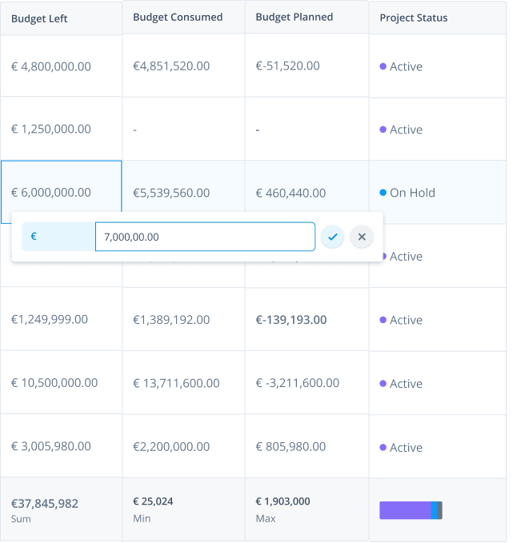
You can adjust the budget or other information directly in the list and get visual feedback directly on the effects it has on your KPIs. For example, something has changed recently, and you need to quickly see an update on how that information now impacts your entire budget. You could also use this functionality to adjust specific numbers to see how that affects your overall portfolio.
Once you have decided on which metrics you want to track and configured your list to show this, some key financial information to compare may include:
- Budget Allocation: Compare the initial budget allocated to each project or initiative within the innovation portfolio. This helps assess whether the allocated resources align with the strategic goals and expected outcomes.
- Actual Spending: Track and compare the actual spending against the allocated budget. This provides insights into how well financial resources are being managed and whether adjustments are needed to stay within budget constraints.
- Return on Investment (ROI): Evaluate the ROI for each innovation project. Comparing the returns against the invested resources helps identify successful initiatives and those that may need optimization or reevaluation.
- Cost per Innovation: Calculate and compare the cost incurred for each innovation project. This metric helps in understanding resource utilization efficiency and identifying projects that may require additional support or modifications.
- Revenue Generation: Compare the revenue generated by each innovation project. This is especially relevant for projects aimed at creating new products or services with a revenue-generating potential.
- Resource Utilization: Analyze how resources, including personnel and technology, are utilized across different projects. This helps in identifying areas of optimization and potential synergies.
- Time-to-Market Costs: Assess the costs related to the time it takes for innovations to reach the market. Faster time-to-market can impact costs and revenues, making it an important factor for comparison.
- Operational and Overhead Costs: Compare operational and overhead costs associated with each innovation project. This includes costs related to facilities, administration, and other ongoing expenses.
- Benchmarking Against Industry Standards: Compare the financial performance of innovation projects against industry benchmarks and standards. This external comparison provides a broader perspective on the portfolio's financial health and competitiveness.
Use data visualization techniques
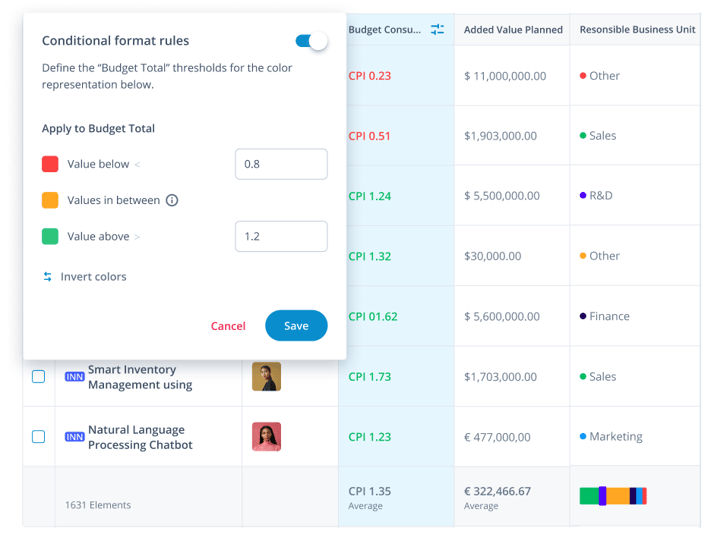
Leverage Conditional Formatting to instantly identify when specific figures exceed or fall below a predefined threshold. For instance, in the Budget Left column, set up color configurations to prompt visual alerts when the threshold is exceeded. Any number below the designated threshold will be automatically highlighted in red, a clear indicator for projects approaching budget constraints.
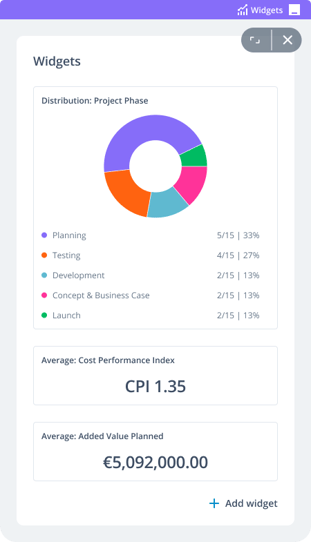
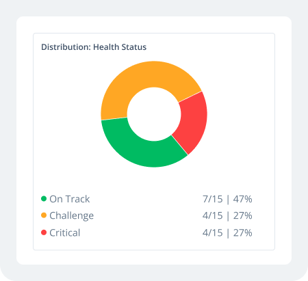
The KPI reporting widget generates interactive visualizations to illustrate specific KPIs within the innovation portfolio. Various types of visualizations can be employed, including:
- Donut Chart: Suited for presenting categorical data such as Health Status, Phase, or Responsible Business Unit.
- Average Card: Provides a rapid summary of the average value for specific criteria across all projects and/or programs in your list.
- Sum Card: Visualizes the total sum of all innovation projects and/or programs in your list.
- Min Card: Highlights the minimum value among all projects and/or programs in your list.
- Max Card: Highlights the maximum value among all projects and/or programs in your list.
Navigating your financial landscape with confidence
Managing an innovation portfolio involves keeping a close eye on budgets, spending wisely, and making decisions based on financial insights. A crucial step in effective portfolio management is understanding your financial situation.
Centralizing financial data gives you real-time spending insights and reduces errors associated with different platforms, ensuring accurate reporting. You don't need to switch between various documents and spreadsheets; you can access a consolidated view of all innovation projects.
With user-friendly tools for tracking, monitoring, and reporting, you can confidently navigate the complex financial landscape of innovation, ensuring you allocate resources well, budget strategically, and manage risks effectively.
Also see: Stop Using Excel Files for Innovation Portfolio Management


.webp??&width=900&height=450&name=Top-10-project-portfolio-software-tech-and-development-teams-use-for-managing-innovation-projects-fullwidth%20(1).webp)
