Half of today's S&P 500 companies will be replaced within ten years. That figure is not a forecast. It is a mathematical projection based on data showing average company tenure has collapsed from 33 years in 1964 to just over 21 years today.
The Rohrbeck and Kum study quantifies what separates the survivors. Among firms with systematic, decision-connected strategic foresight, 40% became industry outperformers over a seven-year window. Among foresight-deficient firms, only 9% improved.
Strategic foresight is not a research function. It is a decision-making practice that moves from sensing weak signals through rigorous analysis and synthesis to action. This article covers ten strategic foresight methods organized across four phases: Sense, Analyze, Synthesize, and Act.
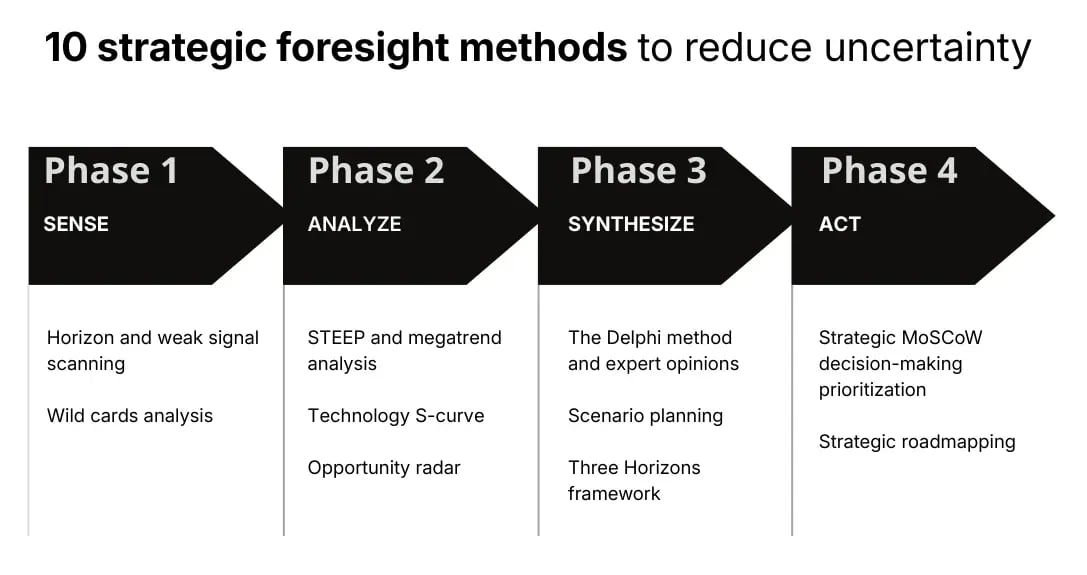
Exhibit 1: 10 strategic foresight methods to reduce uncertainty
Not every method will be relevant to every organization. What is non-negotiable is the sequence of phases. Skipping from sensing to acting without analysis or synthesis is how organizations end up reacting to trends rather than positioning ahead of them.
Before the methods, three structural problems explain why most foresight practices fail to deliver that outcome, and one structural solution explains why a minority succeed.
What separates foresight leaders from trend collectors
Most organizations practicing strategic foresight are doing something far less valuable: collecting trends and distributing them.
Research from the Bavarian Foresight Institute covering more than 400 large US and European companies confirms this. Roughly 90% have some foresight activity, but the majority run it as a secondary function embedded in other departments.
Widespread activity. Minimal strategic influence. That superficiality produces a predictable second problem.
What's killing foresight's influence
The most common failure mode is disconnection. A strategy team builds a signal library, synthesizes a quarterly briefing, and presents it to leadership. The briefing is well-received. It does not shift investment priorities or change resource allocation six months later.
When foresight methods operate independently of the decision-making processes they are meant to inform, insight accumulates without producing agency. That disconnection has a root cause.
Why foresight needs to reach the decision-making table
Resource allocation happens in business reviews. If foresight outputs are not already embedded in the analytical language of those conversations, they will not be consulted when the decision is live.
McKinsey research found that only 8% of companies believe their current business model would remain viable if their industry continues to digitize at its current pace. The insight is not the constraint. The structural capacity to act on it is. That capacity only exists when foresight methods are connected.
The connected system that most foresight teams are missing
Among foresight-deficient firms, 91% declined or held their performance position over seven years. Among firms with systematic strategic foresight, 40% became industry outperformers. The variable is not the quality of individual methods. It is whether those methods operate as a connected system across four phases.
- Sense establishes the intelligence base: monitoring weak signals, emerging trends, and low-probability disruptions before they reach mainstream awareness.
- Analyze converts that raw intelligence into structured insight: mapping macro forces, technology trajectories, and the opportunity landscape with analytical rigor.
- Synthesize turns that insight into strategic judgment: building scenarios, governing investment across time horizons, and preparing the organization for multiple possible futures.
- Act closes the loop: translating scenario outputs into prioritized commitments and a sequenced roadmap with built-in adaptability.
Not every method within each phase will be relevant to every organization. What is non-negotiable is the sequence. Sensing without analyzing produces noise. Analyzing without synthesizing produces data that never becomes a story. Synthesizing without acting produces alternative futures that never influence the present.
/environmental-scanning-team.webp?width=966&height=196&name=environmental-scanning-team.webp)
Exhibit 2: Foresight team roles
The ten strategic foresight methods to stay ahead of competition
The methods below are organized across four phases: Sense, Analyze, Synthesize, and Act. Not every method will be relevant to every organization. Context, maturity, and strategic questions differ. What does not differ is the need to move through all four phases.
Each phase produces the input that the next one requires. Select the methods that fit. Respect the sequence. That combination is what separates organizations that generate foresight intelligence from those that act on it.
Phase 1 | Sense
Every foresight system starts with the same question: what is changing, and where?
The Sense phase answers it by building a continuous, structured intelligence base before competitors have noticed the signals.
Sense | 1. Horizon scanning and weak signals
Systematic monitoring of weak signals across time horizons and domains to detect emerging issues and potentially important developments before competitors act on them.
Horizon scanning is where the strategic foresight process begins. It surfaces future events and emerging trends before they reach mainstream awareness, giving organizations a timing advantage that determines whether they shape change or respond to it.
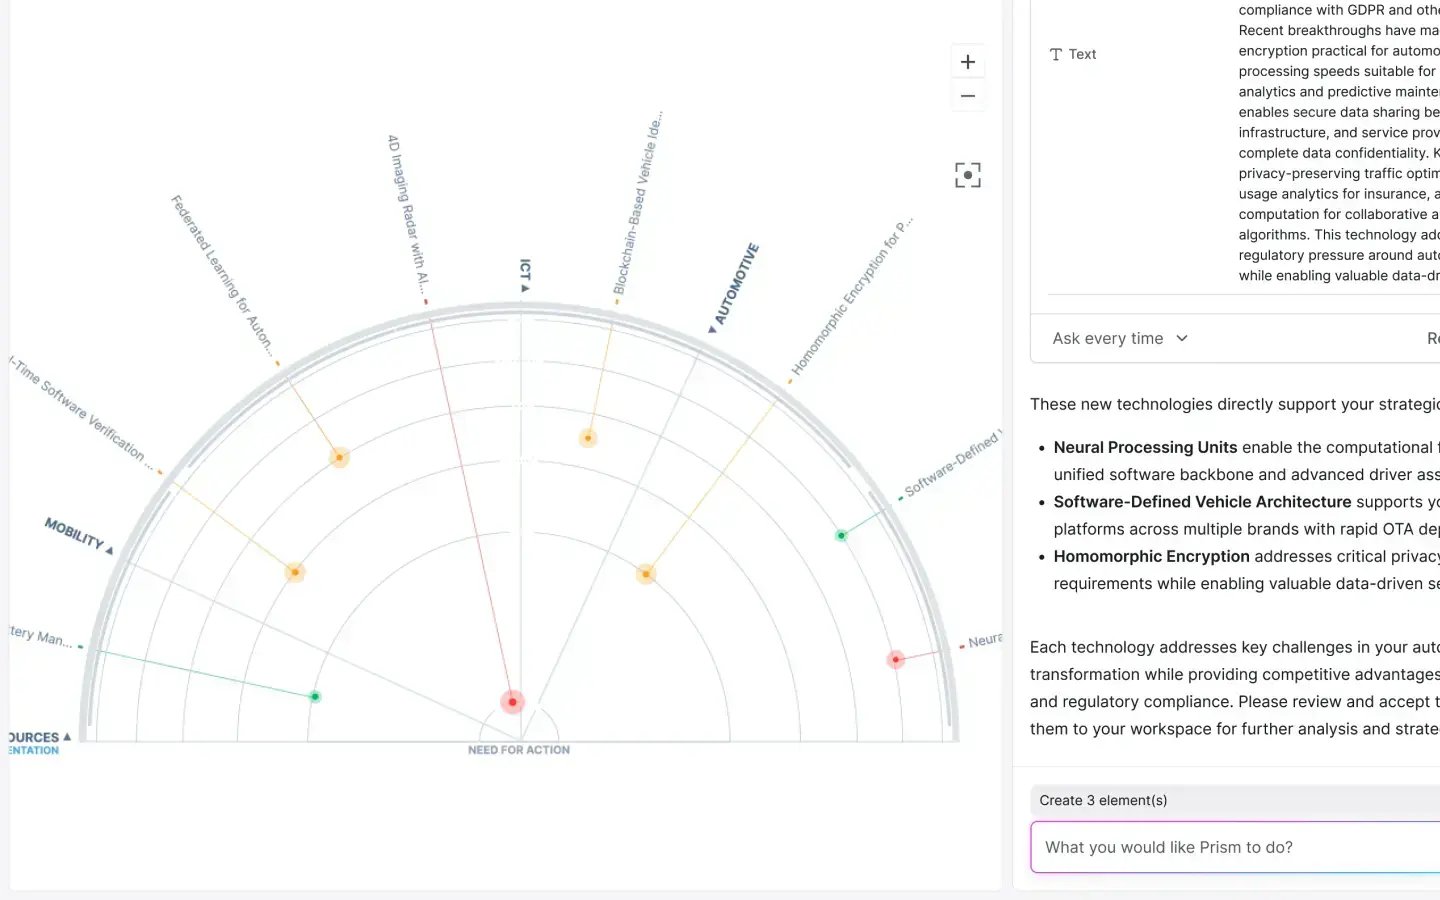
Exhibit 3: AI assistant auto-recommending technologies based on strategic priorities
When to use it: Continuously, with increased intensity before major investment decisions, market entries, or portfolio reviews.
How to run it:
- Define scanning scope across three horizons: near-term (1-3 years), mid-term (3-7 years), long-term (7+).
- Assign five to seven scanning domains with named owners: technology, regulation, geopolitics, adjacent industries, consumer behavior, and sustainability.
- Build a shared signal intake system fed by desk research, expert interviews, and automated discovery. Signals live in a shared system, not individual inboxes.
- Run weekly triage: noise versus genuine weak signal versus strengthening signal.
- Tag by domain, time horizon, and confidence level. Route prioritized signals into STEEP analysis (Method 3).
What to watch for: Scanning only your own industry. The most disruptive weak signals rarely originate within the sector they will reshape. McKinsey's disruption research found incumbents consistently underestimate mid-term change pace: what organizations expected in ten years arrived in five.
How ITONICS supports this: ITONICS automates signal discovery from curated external sources with AI-assisted filtering and supports collaborative tagging in real time. Decision makers access the signal library directly, replacing the RSS feeds, spreadsheets, and email threads most organizations currently rely on.
Connects to: Wild Cards Analysis (Method 2) and STEEP Analysis (Method 3).
Sense | 2. Wild cards analysis
Structured identification of low-probability, high-impact future events that could fundamentally alter your operating environment before you have time to prepare responses.
Wild cards analysis builds greater knowledge of potential risks outside the normal planning horizon. These are the emerging issues most strategy teams never formally examine. The National Intelligence Council uses structured wild card analysis for precisely this purpose: the future opportunities most worth preparing for are often the ones that appear unlikely until they materialize rapidly.
When to use it: When scenarios feel too incremental, when making long-horizon capital commitments, or when the macro environment has widened the range of plausible future changes.
How to run it:
- Convene a cross-functional group with genuinely different domain expertise and mental models.
- Brainstorm future events that would radically alter your environment regardless of perceived likelihood: geopolitical realignments, technology breakthroughs, regulatory upheavals, and climate events.
- For each wild card, define a plausible narrative, an impact assessment across operations and markets, and a set of early indicators to monitor.
- Rank by impact severity, not likelihood.
- Feed early indicators back into the horizon scanning watch-list.
What to watch for: Generating wild cards with no early indicators. Without them, there is no mechanism to detect relevance until the event has already arrived.
How ITONICS supports this: ITONICS stores wildcards alongside the signal library, so early indicators link directly to live signals being monitored. The disruption register stays connected to live intelligence rather than sitting in a workshop document.
Connects to: Horizon Scanning (Method 1) and Scenario Planning (Method 7).
Phase 2 | Analyze
With the signal base established and edge-case risks documented, the Analyze phase converts raw intelligence into structured competitive insight.
Analyze | 3. STEEP and megatrend analysis
A structured framework for organizing collected signals into the macro forces reshaping your environment and mapping organizational exposure to the long-wave emerging trends defining the next decade.
Weak signals are raw material. STEEP analysis converts them into strategic intelligence by placing emerging issues inside a structural picture. It determines which observed signals reflect forces requiring strategic response and which require only monitoring.
/STEEP-framework.webp?width=2502&height=1409&name=STEEP-framework.webp)
Exhibit 4: STEEP framework components explained
When to use it: After horizon scanning has produced a signal set requiring interpretation. When preparing for scenario development or when decision makers need a structured view beyond disconnected current trends.
How to run it:
- Map each prioritized signal to its primary STEEP domain: Social, Technological, Economic, Environmental, or Political.
- Within each domain, distinguish one-off events from deeper structural forces.
- Cluster structural signals into megatrends operating across 10-20 year timeframes: urbanization, demographic aging, climate transition, digital infrastructure build-out, geopolitical multipolarity.
- Map interdependencies between megatrends and compounding STEEP intersections.
- Score organizational exposure and readiness against each megatrend.
What to watch for: Conflating megatrends with trends. A megatrend carries 10-20 years of structural momentum. A trend may reverse within a planning cycle. Confusing the two leads to over-investing in what fades and under-investing in what endures.
How ITONICS supports this: ITONICS provides a curated megatrend library where signals flow directly into megatrend categories. Exposure assessments are maintained collaboratively in real time, so analytical work accumulates across planning cycles rather than resets.
Connects to: Technology S-Curve (Method 4) and Scenario Planning (Method 7).
Analyze | 4. Technology S-curve
A model for understanding where each relevant technology sits in its development trajectory so that investment decisions reflect commercial reality rather than market hype.
STEEP analysis identifies technology as a structural force. The S-curve determines where in that trajectory each technology sits and what that timing means for investment. It reveals the trade-offs between early positioning and evidence-based commitment.
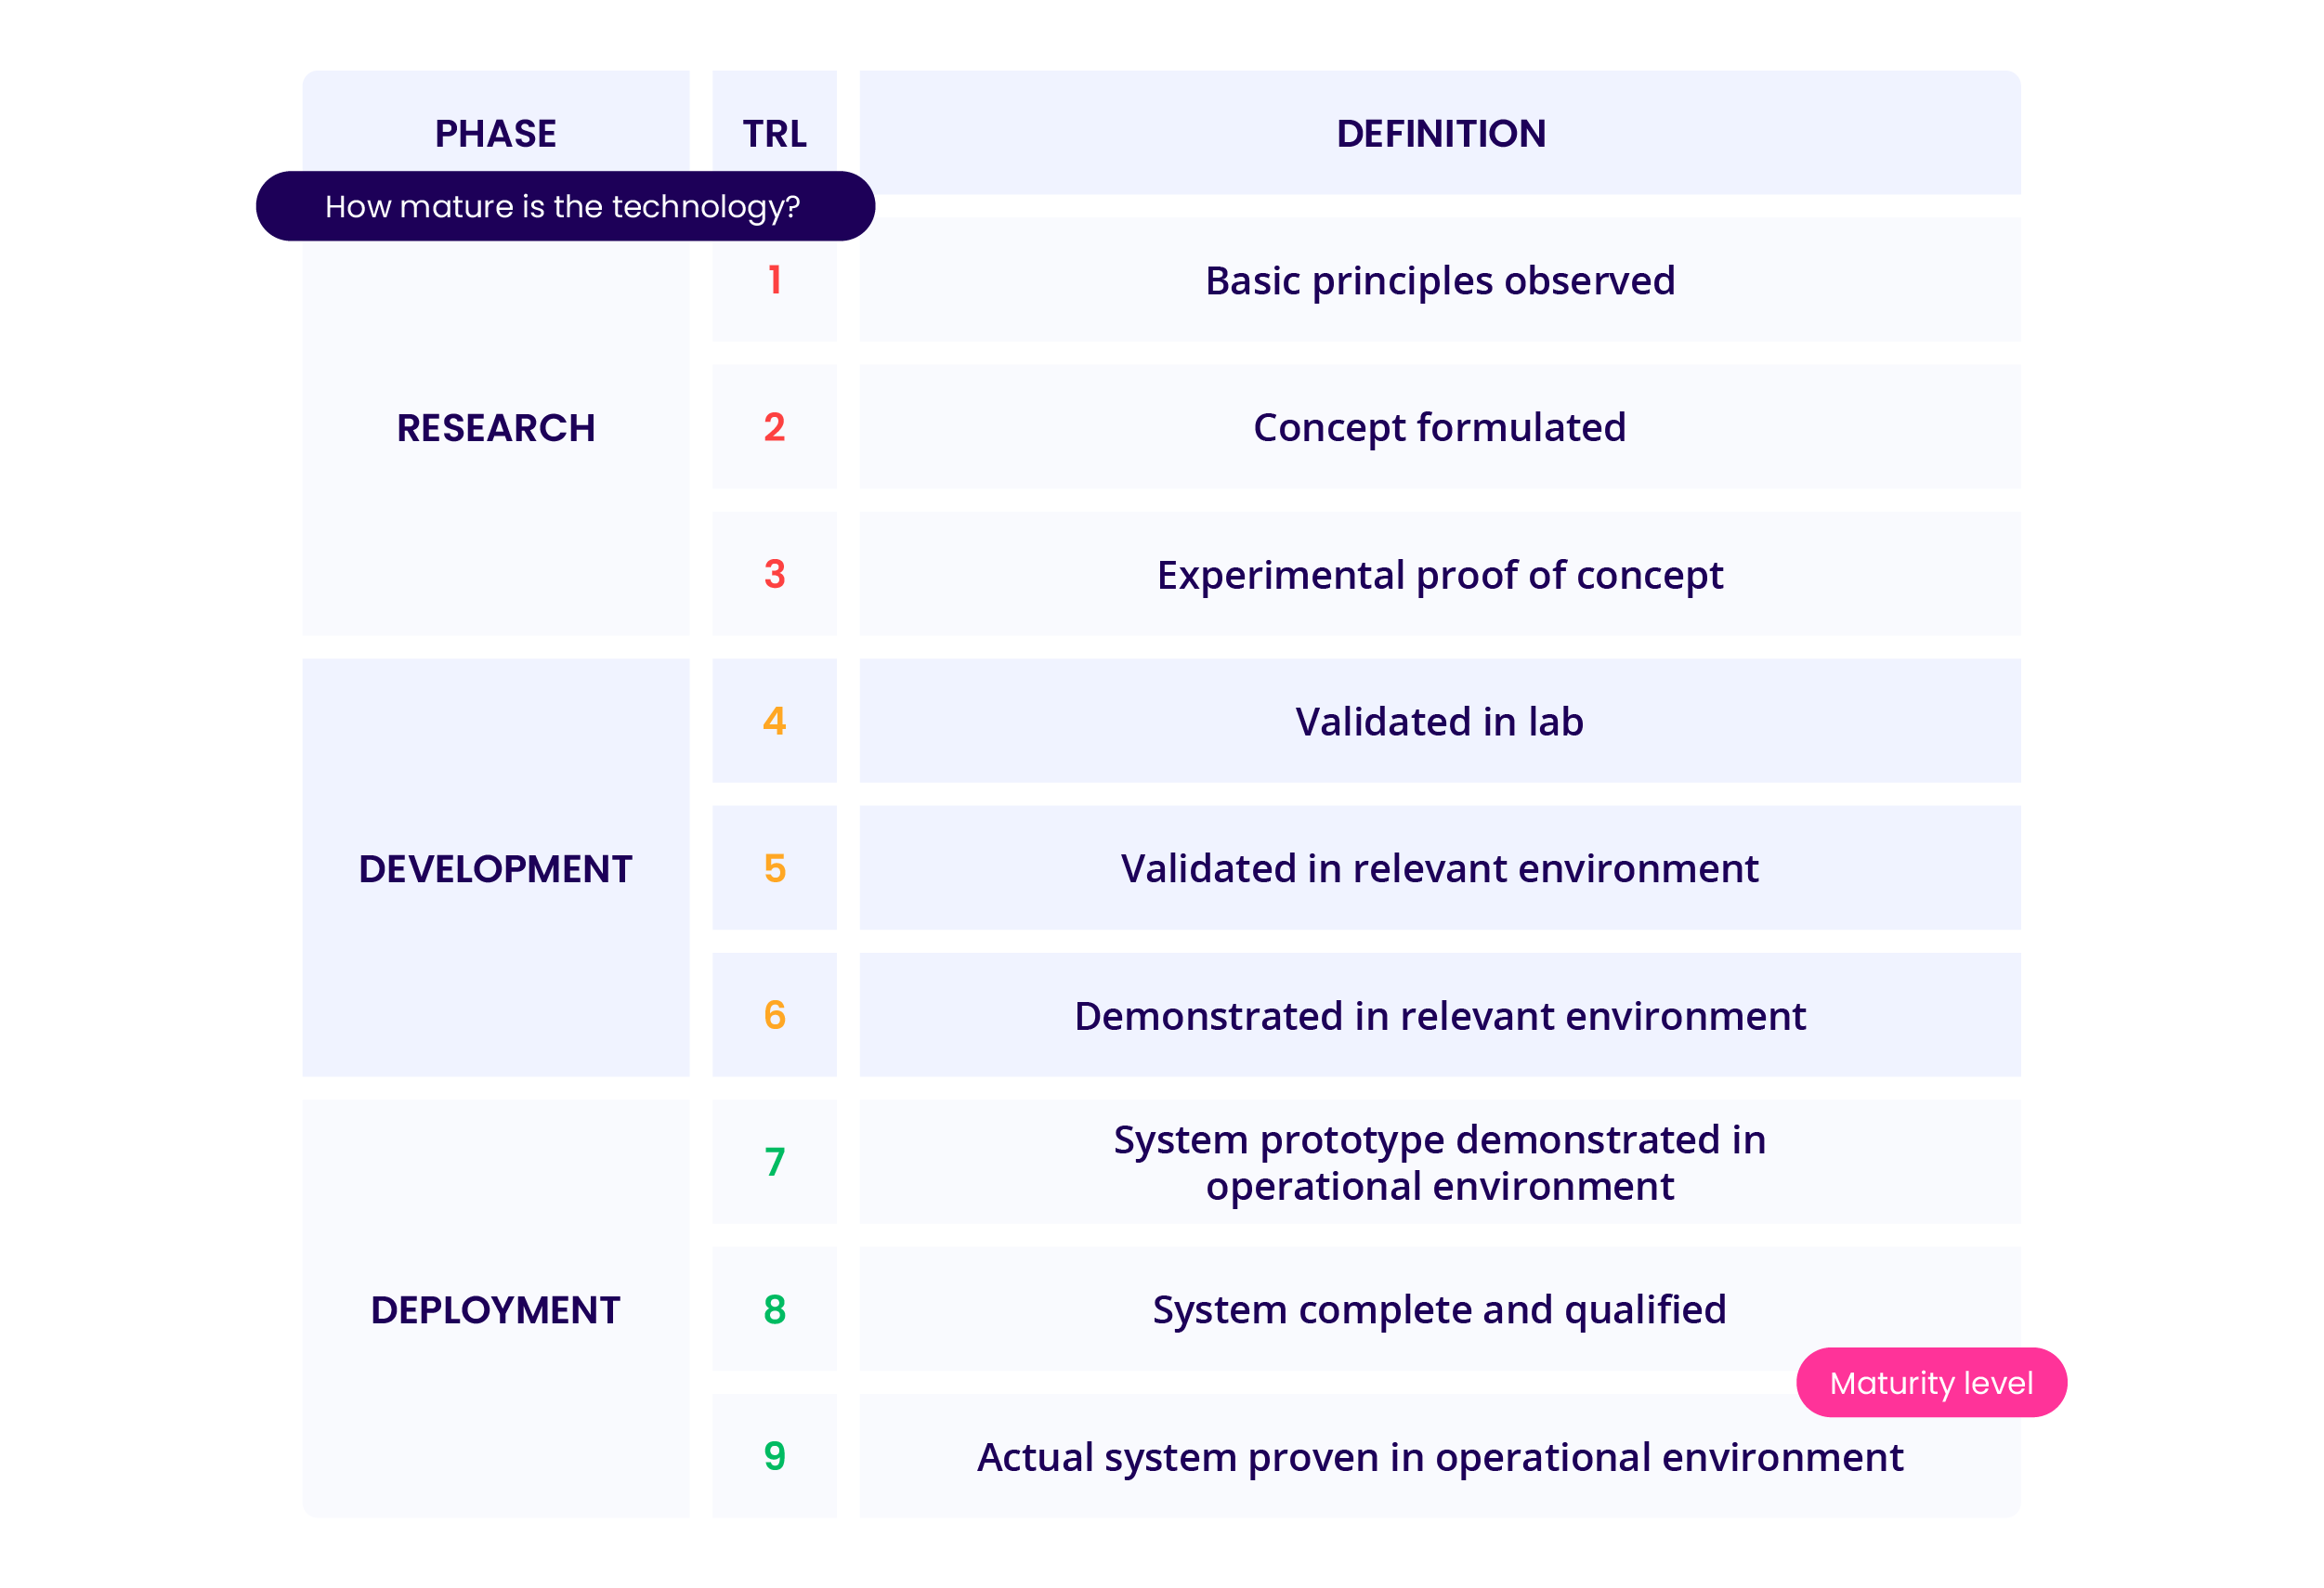
Exhibit 5: Technology readiness scales explained | ITONICS
When to use it: When evaluating investment timing in an emerging technology, when assessing whether a core technology is approaching obsolescence, or when new technologies require leadership to separate signal from hype.
How to run it:
- List technologies most relevant to the competitive position, both current and emerging.
- Map each to one of three S-curve phases: emergence (limited adoption, high cost), growth (proven viability, accelerating adoption), or maturity (commoditized, compressed margins).
- Calibrate position using adoption indicators: venture investment volume, commercial deployments, cost trajectory, regulatory engagement, talent market activity.
- Define strategic implications per phase: emergence warrants experimentation; growth demands capability building; maturity requires transition planning.
- Map ageing technologies against emerging replacements. The window between them defines the transition timeline.
What to watch for: Entering a technology in the growth phase while believing you are capturing early-mover advantage. By that stage, leading positions are established, and access costs have risen significantly.
How ITONICS supports this: ITONICS provides a Technology Radar environment where technologies are tracked against their development trajectory and linked to live signal and megatrend data. All stakeholders work from a single, continuously updated view.
Connects to: STEEP Analysis (Method 3) and Opportunity Radar (Method 5).
Analyze | 5. Opportunity radar and matrix
A structured map of emerging trends and future opportunities plotted by timing and strategic fit, creating a forcing mechanism against the near-term bias that dominates most resource allocation decisions.
STEEP and S-curve analysis reveal what forces are at play and where technologies sit. The opportunity radar translates that into a portfolio view leadership can act on, placing every identified opportunity in a single frame that makes near-term bias immediately visible.
When to use it: When translating signals and megatrend analysis into a strategic opportunity portfolio, or when the growth pipeline is underpopulated or weighted disproportionately toward the near term.
How to run it:
- Compile prioritized future opportunities from horizon scanning, STEEP analysis, and technology S-curve outputs.
- Build the radar on two axes: timing (proximity to commercial viability) and strategic fit (alignment with capabilities and direction).
- Plot each opportunity. Near-term, high-fit sits at the center. Long-term, lower fit at the edge.
- Deliberately populate mid-term and long-term rings. An underpopulated outer ring is a strategic finding that requires a leadership response.
- Review the full portfolio for balance and alignment with the organization's stated risk appetite.
What to watch for: Filling only the near-term rings. This is the most prevalent failure mode in opportunity portfolio management, driven by the systematic pull toward what appears immediately actionable.
.webp?width=1212&height=823&name=Opportunity%20Matrix%20with%20Sustainable%20Packaging%20(1).webp)
Exhibit 6: Opportunity Matrix with Sustainable Packaging
How ITONICS supports this: ITONICS provides interactive radar and matrix views where opportunities, technologies, and emerging trends are plotted and maintained collaboratively. Leadership interrogates the full portfolio of possible futures in real time.
Connects to: Methods 3 and 4 as inputs. Methods 7 and 8 as outputs.
Phase 3 | Synthesize
The Analyze phase has produced a structured picture of the environment.
The Synthesize phase turns that picture into strategic judgments about which futures are plausible, which are desirable, and what they each demand.
Synthesize | 6. The Delphi method and expert opinions
A multi-round expert consultation process that surfaces calibrated opinion across diverse perspectives while systematically eliminating the groupthink, hierarchy effects, and anchoring that corrupt most expert panels.
The Delphi method separates independent judgment from social influence by collecting and anonymizing expert views before any group interaction occurs. It is applied by the US military, federal agencies, and large companies precisely because it produces defensible, calibrated expert opinion rather than the appearance of consensus.
When to use it: When quantitative data is thin, and judgment is the primary analytical input. When internal teams are too homogeneous. When policy-making decisions require structured input from subject matter experts across multiple domains.
/Still%20images/List%20Mockups%202025/capabilities-views-keep-it-public-or-not.webp?width=2160&height=1350&name=capabilities-views-keep-it-public-or-not.webp)
Exhibit 7: An evaluated idea list shared with other stakeholders
How to run it:
- Define the question with precision. Vague questions produce vague consensus.
- Select subject matter experts with genuine diversity across disciplines, industry, geography, and seniority.
- Round 1: all panelists respond independently. Responses are collected and anonymized.
- Synthesize Round 1. Map consensus, disagreement, and the reasoning behind divergent positions.
- Rounds 2 and 3: share anonymized synthesis and invite revision. Document both convergence and persistent disagreement. Expert fault lines are frequently as strategically valuable as the consensus.
What to watch for: Running a panel discussion and categorizing the output as Delphi method output. Without anonymization and iterative rounds, the process measures confidence, not evidence quality.
How ITONICS supports this: ITONICS supports asynchronous expert input and rating workflows across internal and external contributors. Outputs feed directly into scenario development.
Connects to: Scenario Planning (Method 7). The consensus and fault lines produced by the Delphi method become the raw material for defining scenario boundaries and critical uncertainties.
Synthesize | 7. Multiple scenarios, normative scenarios, and scenario planning
The development of distinct, plausible futures built on critical uncertainties, used to test strategic robustness, expose assumption risk, and materially upgrade decision-making processes.
A strategy optimized for one future is a bet. Scenario planning converts it into a portfolio across multiple possible futures, directly connecting environmental analysis to strategic resource allocation. The scenario method encompasses distinct approaches: multiple scenarios explore alternative futures from critical uncertainties; normative scenarios define a desirable future and trace the path to reach it; scenario forecasting applies probability estimates for risk management. War games extend this further, simulating competitor and regulator responses to stress-test not just the external environment but the organization's own strategic moves within it.
When to use it: When making resource commitments with 5-10 year implications, when the current strategic plan has not been stress-tested against alternative futures, or when competitive dynamics make predictions from current trends alone insufficient.
How to run it:
- Identify two or three critical uncertainties: highly consequential, genuinely unpredictable forces that define your scenario axes.
- Build two to four internally coherent scenarios at their intersection. Draw on historical data to ground each in precedent. Distinguish possible futures from normative scenarios pointing toward a desirable future.
- Stress-test current strategy against each scenario: where does it hold? Where does it break? Run war games to simulate adversarial responses under adverse conditions.
- For normative scenarios, work backward from the desirable future to map the required strategic sequence.
- Identify robust strategies that hold across most scenarios, and contingent strategies tied to specific futures.
What to watch for: The optimistic/pessimistic/most-likely trap. These are points on a probability distribution, not genuine scenario planning. Rigorous scenario planning explores qualitatively different alternative futures.
How ITONICS supports this: ITONICS maintains future scenarios as living documents connected to the signals and megatrends that generated them. Indicator monitoring tracks which future is materializing.
Connects to: Methods 3 and 6 as inputs. Methods 8 and 9 as outputs. Scenario planning defines the strategic options and their conditions; Three Horizons determines how those options are governed and funded across time.
Synthesize | 8. Three Horizons framework
A framework for simultaneously governing today's core business, tomorrow's emerging growth opportunities, and the transformational possibilities that will define long-term competitiveness, with each horizon managed under distinct metrics, timelines, and investment logic.

Exhibit 8: The three innovation horizon model and investment split
Only one in five companies strategically prepares for future market changes. Only one in twenty adjusts course accordingly (Rohrbeck and Kum). Three Horizons builds institutional capacity for future planning by making long-horizon investment a structural commitment rather than a discretionary addition.
When to use it: When allocating innovation investment across time horizons, particularly when H1 performance pressure is systematically crowding out H2 and H3 investment.
How to run it:
- Map activities into three horizons: H1 (optimizing current performance), H2 (building near-future growth), H3 (preparing for transformational futures).
- Define success metrics per horizon. H1: profitability and efficiency. H2: growth rate and market traction. H3: learning, optionality, and strategic positioning.
- Audit distribution. No horizon should be empty or systematically defunded.
- Map scenario planning outputs to each horizon: which scenarios demand H1 optimization? Which require H3 positioning now?
- Define transition triggers: what specific conditions move an H3 initiative to H2, or H2 to H1?
What to watch for: Treating the three horizons as sequential rather than simultaneous. All three require concurrent governance. Running H3 without defined transition triggers converts exploratory investment into permanent overhead.
How ITONICS supports this: ITONICS supports portfolio management across innovation horizons with configurable scoring frameworks and horizon visualization. H3 initiatives remain visible and governed even under quarterly performance pressure.
Connects to: Scenario Planning (Method 7) as input. MoSCoW Prioritization (Method 9) as output.
Phase 4 | Act
The Synthesize phase has produced a portfolio of options governed across three horizons. The Act phase converts that into specific commitments and a sequence for executing them.
Act | 9. Strategic MoSCoW decision-making prioritization
A framework for translating foresight outputs into an explicit, defended hierarchy of strategic action, forcing commitment to what the organization will do, defer, and deliberately not pursue.
Most strategy processes produce agreement on what to pursue. They rarely produce agreement on what to stop. MoSCoW addresses both. The result is action planning that reflects the full implications of scenario planning work rather than the priorities that survived the loudest internal advocacy.
When to use it: Immediately after scenario planning and Three Horizons work, when strategic options exceed available resources, and when leadership needs a shared analytical framework for resource allocation.
How to run it:
- Compile all strategic options from scenarios, opportunity radar, and Three Horizons work.
- Apply four categories: Must Have (non-negotiable across all future scenarios), Should Have (high-value but not survival-critical), Could Have (genuinely optional, pipeline-ready), Won't Have (explicit commitment not to pursue).
- Validate each classification against the scenario set. A Must Have that only holds in one scenario may be a Could Have.
- Document the Won't Have list with explicit rationale. Reopening requires a named strategic conversation with documented justification.
- Use the output as the evidence base for resource allocation decisions.
What to watch for: Everything becoming a Must Have. When every initiative is essential, the framework has produced the same outcome as no framework at all.
How ITONICS supports this: ITONICS attaches prioritization classifications directly to initiatives alongside the signals, megatrends, and scenarios that justify each classification. Priority decisions become transparent and auditable.
Connects to: Methods 7 and 8 as inputs. MoSCoW produces the ranked list of commitments; strategic roadmapping sequences them into a time-bound execution plan with built-in adaptability.
Act | 10. Strategic roadmapping
A time-sequenced, scenario-connected plan that translates prioritized decisions into coordinated organizational commitments, with built-in choice points that keep the roadmap adaptive rather than locked to a single assumed trajectory.
This is where the foresight process closes its loop. Roadmap milestones trigger the next horizon scanning cycle, converting strategic foresight from a periodic activity into a continuous organizational capability.
When to use it: After MoSCoW prioritization has produced a clear hierarchy of strategic initiatives and when multiple functions need to align around a shared long-term direction.
How to run it:
- Take MoSCoW Must-Haves and Should-Haves as primary inputs.
- Build the roadmap across key dimensions: capabilities to develop, new technologies to adopt or retire, products to launch or discontinue, partnerships to establish, market positions to build or defend.
- Define explicit choice points: decision nodes where the forward path depends on which scenario signals are strengthening. Document what evidence is monitored and what triggers Path A versus Path B.
- Assign milestones with named owners, success criteria, and linked leading indicators from the foresight signal library.
- As each milestone approaches, trigger a signal review to assess whether underlying scenario assumptions remain valid.
What to watch for: Building a roadmap without choice points. When reality diverges from assumption, a roadmap without choice points becomes incorrect rather than adaptive.
How ITONICS supports this: ITONICS builds strategic roadmaps within the same environment as signals, scenarios, and portfolios. The connection between foresight intelligence and execution is structural, not dependent on manual cross-referencing.
Connects to: MoSCoW Prioritization (Method 9) as input. Closes the loop to Horizon Scanning (Method 1).
/Still%20images/Roadmap%20Mockups%202025/portfolio-visualize-critical-paths-2025.webp?width=2160&height=1350&name=portfolio-visualize-critical-paths-2025.webp)
Exhibit 9: Roadmap with projects and milestones showing schedule conflicts
Ten methods. Four phases. One strategic foresight system.
Each foresight method in this article is individually well-established. Organizations that extract disproportionate value from them run them as a connected sequence: each method's output becomes the input for the next.
ITONICS connects all four phases in a single strategic foresight platform. Horizon scanning feeds analysis, analysis feeds scenario planning, scenario planning feeds decisions, and decisions feed back into the next scanning cycle. The link between a weak signal and a strategic investment is visible, traceable, and defensible.
Foresight teams that operate at this level do not produce better briefings. They produce better decisions, and they can demonstrate it with evidence.
If you are ready to move from collecting current trends to driving strategy, see how ITONICS supports every foresight method in this system.