A trend radar is like a lighthouse in the fog of uncertainty, guiding businesses toward opportunities and away from risks. Visualizing emerging trends and their impact within the business environment helps organizations navigate rapidly changing times with clarity, ensuring they stay ahead of the curve and chart a successful course forward.
What is a trend radar?
A trend radar is a visual tool that helps organizations identify, monitor, and prioritize emerging trends. It organizes trends into categories based on their relevance, urgency, and potential impact, often displayed in concentric circles or zones, allowing for the analysis and navigation of individual trends.
This format makes it easy to see which trends are closer to becoming actionable and which are still in the exploratory phase. It combines data, expert insights, and foresight to provide clarity in a rapidly changing world.
For innovation professionals, a trend radar is essential for tracking shifts in consumer behavior, technology, and market dynamics. Whether for product development or strategic planning, it ensures businesses stay ahead of the curve by highlighting future opportunities and challenges.

What is the optimal structure for a trendradar?
A trend radar organizes information visually to make trends easy to analyze and prioritize. Its structure includes several key components:
-
Segments: These divide the radar into categories, such as STEEP (social, technological, ecological, economic, political trends). Segments help cluster and focus attention on specific areas of interest.
-
Distance to the center: Trends closer to the center are more urgent or impactful, while those farther away are less immediate but still worth monitoring.
-
Color: Colors represent the status or type of trend, such as emerging (green), maturing (yellow), or declining (red).
-
Size: The size of each trend indicates its potential impact or importance, with larger trends requiring greater attention.
This structure ensures clarity, helping teams align insights with strategy.
Why companies need a radar of trends
Companies need a trend radar to stay competitive in an ever-changing market. It helps identify emerging opportunities and risks early, allowing businesses to adapt and innovate proactively.
By organizing trends based on reach, impact, and confidence (cf. RICE prioritization framework), a trend radar allows teams to focus on what matters most. It supports better decision-making, ensures alignment with long-term goals, and reduces the risk of being blindsided by disruptive forces.
For innovation professionals, a trend radar fosters collaboration, streamlines trend scouting, and provides a clear framework for strategic planning. It’s an indispensable tool for building a future-ready organization that aligns with the goals of the entire organization.
What are relevant trends to track on a trend radar?
The latest trends to track depend on your industry and strategic goals but typically include shifts in technology, consumer behavior, market dynamics, and regulations. Trends that impact innovation, sustainability, digitalization, and customer preferences are especially important.
A good trend radar balances global megatrends, such as climate action or digital transformation, with emerging signals like AI applications or new consumer habits. It’s also important to track cross-industry trends that could create opportunities or disruptions.
Consider trends that align with your organization’s focus, have high potential impact, or are gaining momentum in your sector, ensuring your radar remains actionable and future-focused.
What is a trend?
A trend is a noticeable shift in behavior, preferences, or practices that grow in influence over time. It reflects emerging changes in society, technology, markets, or culture that can shape the way people live, work, and interact.
Trends often start as weak signals—subtle patterns or innovations—and gain momentum as they resonate with broader needs or challenges. Unlike short-lived fads, trends have a lasting impact and the potential to drive significant transformation.
For organizations, understanding trends is essential for staying relevant, identifying opportunities, and navigating disruptions in a rapidly changing world.
How to create a trend radar that works
Step 1: Define the radar's scope and purpose
Start by clearly defining the focus of your trend radar. Identify the specific areas you want to explore, such as technology, consumer behavior, or market developments, and align these with your strategic goals. Determine the time horizon you’re considering—short-term, mid-term, or long-term—and the audience for your radar, whether internal teams or external stakeholders.
A clear scope ensures your radar remains actionable and relevant, helping you prioritize trends that matter most to your business. It also prevents information overload, focusing attention on opportunities and challenges that directly impact your organization’s innovation and growth strategy, preparing you for the future today.
Step 2: Collect key trends from different sources
Gather insights from diverse, credible sources to build a comprehensive radar that adapts to market changes. Use tools like industry reports, market research, and news analysis to identify global and regional trends. Leverage input from internal teams, expert panels, or foresight communities for unique perspectives.
Don’t overlook weak signals—early indicators of potential trends—and explore sectors outside your own for cross-industry influences. Combining data-driven insights with expert knowledge ensures your radar reflects both emerging opportunities and well-established shifts, offering a holistic view of the evolving landscape.
Step 3: Define your evaluation criteria and categorize the trends
Establish clear criteria to evaluate trends, such as their potential impact, relevance to your organization, and time to maturity. Use these criteria for prioritizing trends and categorizing them into actionable groups.
Arrange trends on your radar based on urgency (distance from the center) and type (segments like technology, consumer behavior, or sustainability). Use color and size to visually represent trend status and impact, making it easier to understand at a glance.
This structured approach ensures your radar is intuitive, helping decision-makers quickly grasp the most critical insights and align them with business strategy.

Step 4: Share your trend radar with the right audience
A trend radar is most effective when shared with those who can act on its insights. Tailor the presentation to your audience, whether it’s leadership, innovation teams, or external partners. Use clear visuals and concise explanations to make trends understandable and actionable.
Encourage discussions around the radar to align stakeholders, prioritize initiatives, and explore opportunities. A collaborative approach ensures the radar doesn’t just inform but actively drives strategic decisions, fostering innovation and forward-thinking within your organization.
Step 5: Build a routine and regularly update Your radar with emerging trends
A trend radar isn’t static; it requires continuous monitoring to evolve with the environment. Establish a routine for monitoring and adding new trends, revisiting existing ones, and removing outdated or irrelevant items.
Schedule regular updates—monthly, quarterly, or annually—depending on your industry’s pace of change. Engage your team in the process to incorporate fresh insights and ensure alignment with evolving priorities.
By maintaining an up-to-date radar, you’ll stay ahead of emerging opportunities and threats, keeping your organization agile and ready to adapt to the future. A dynamic radar is key to effective trend management.
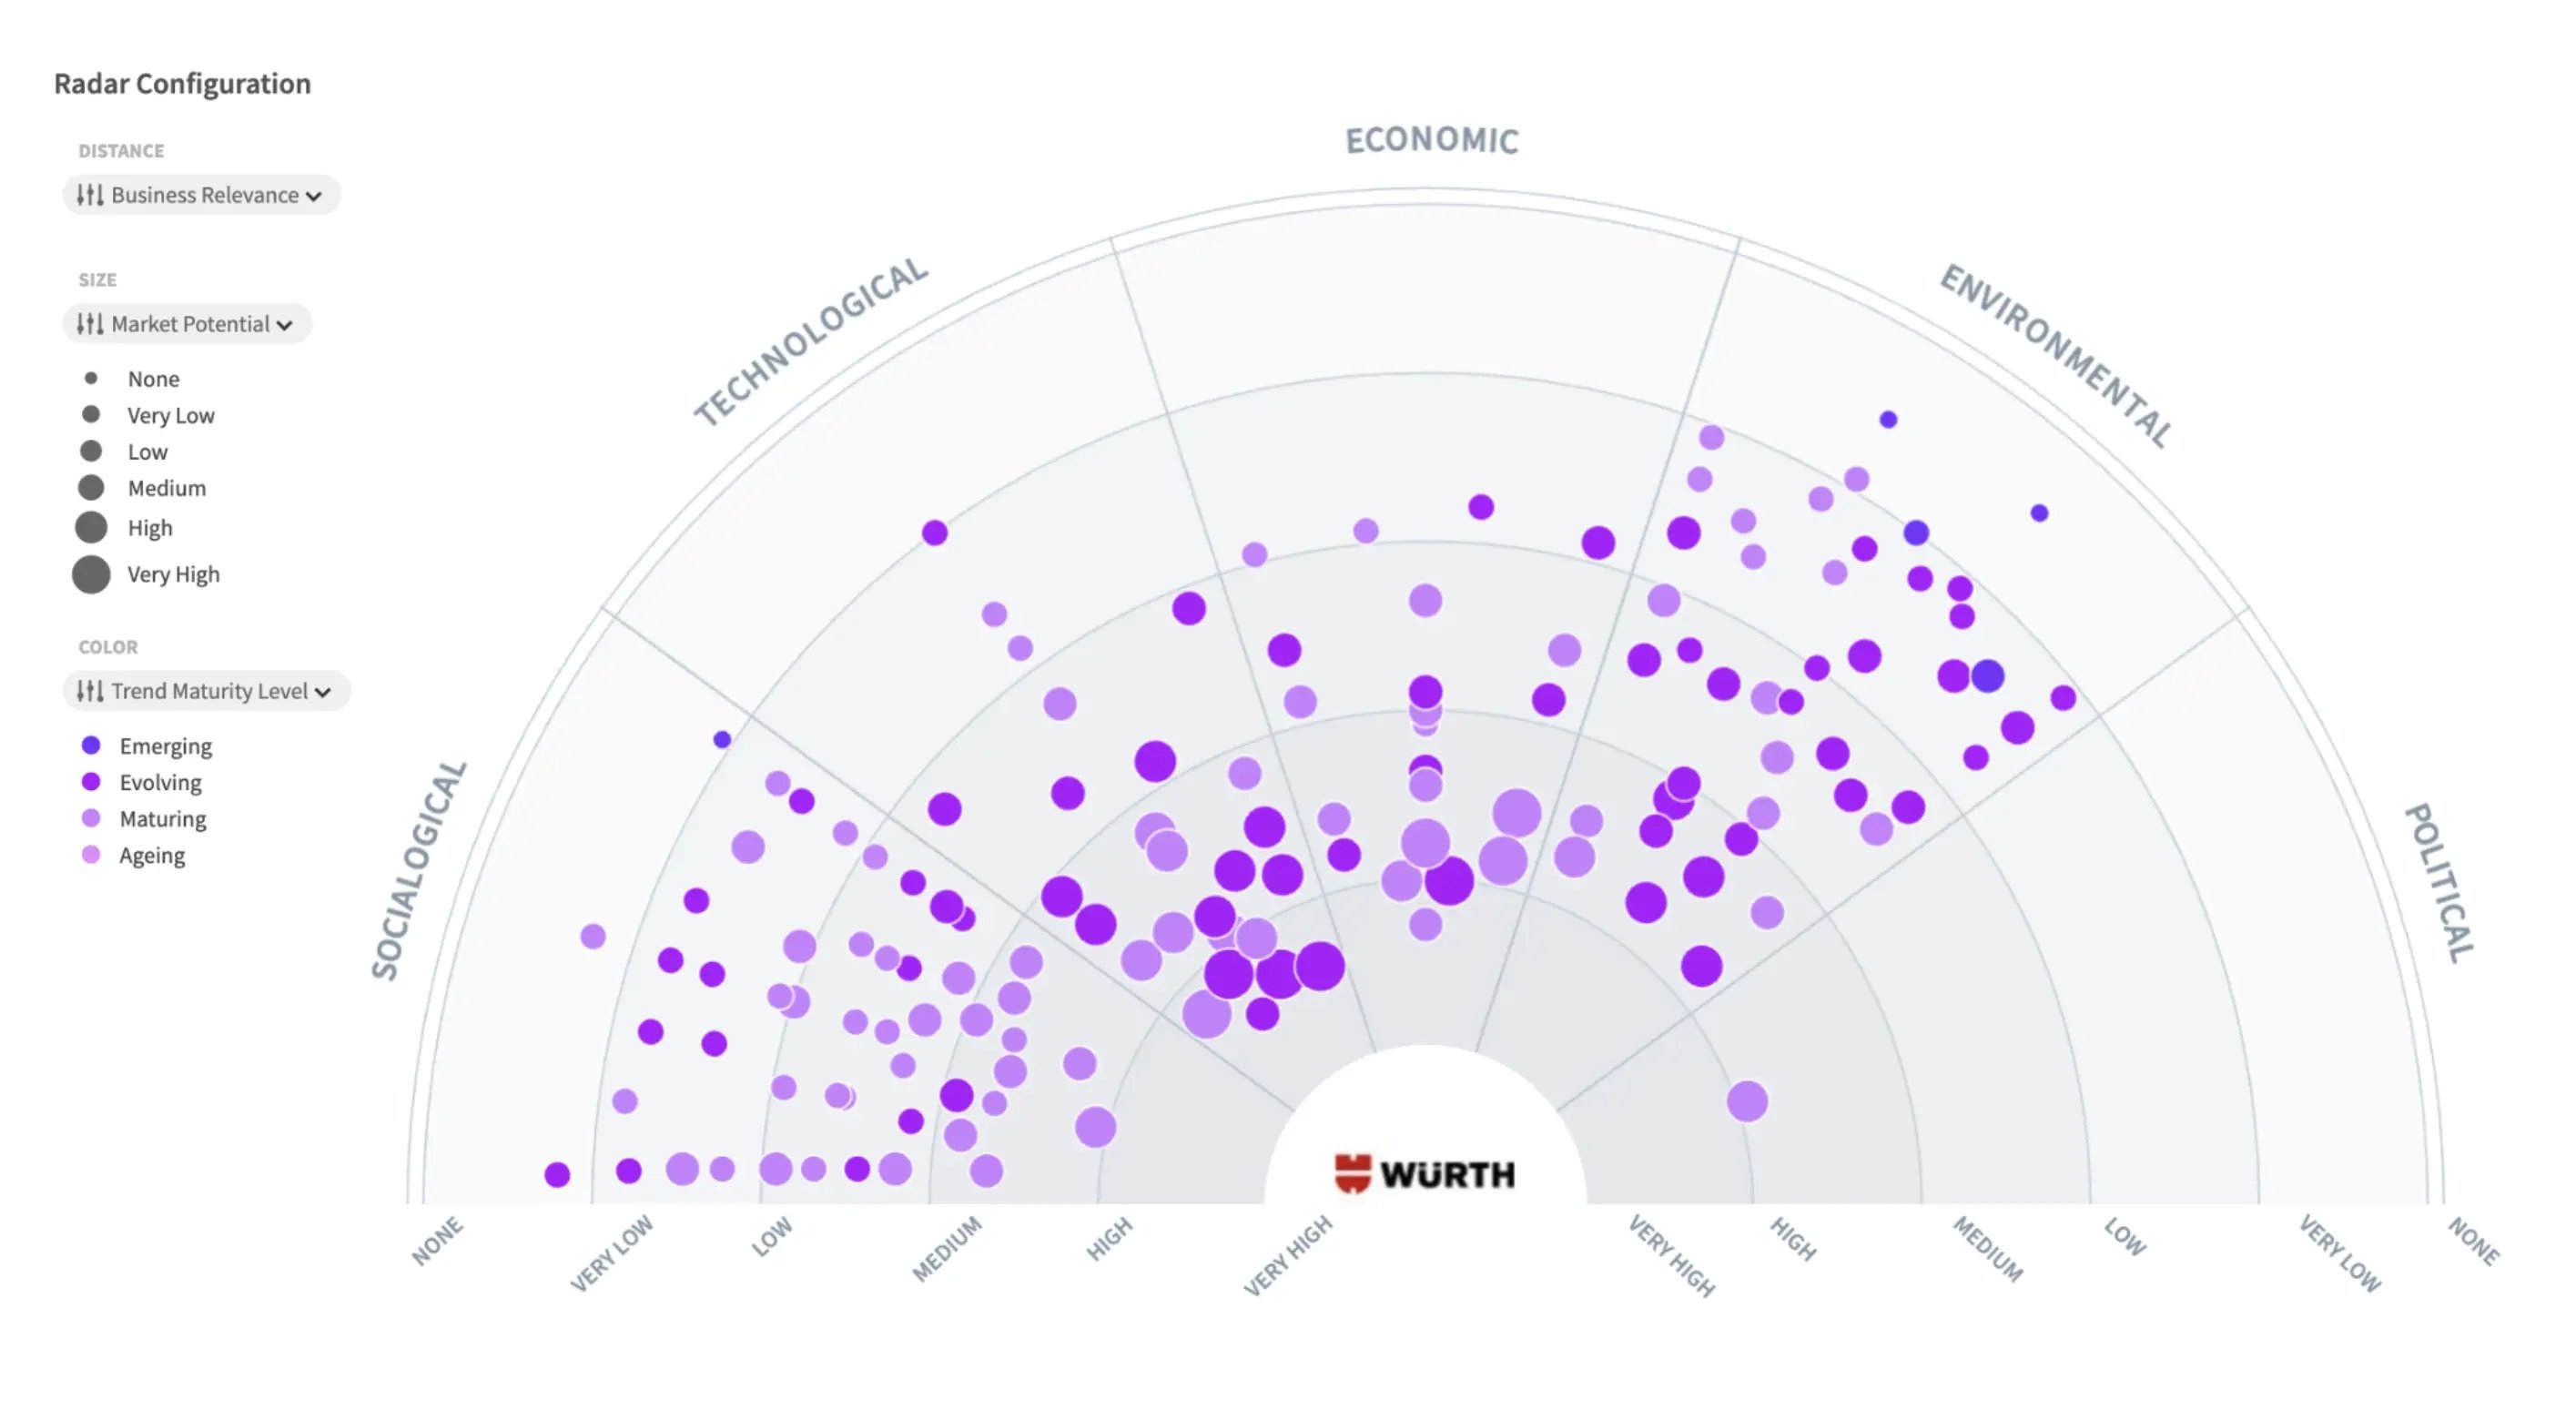
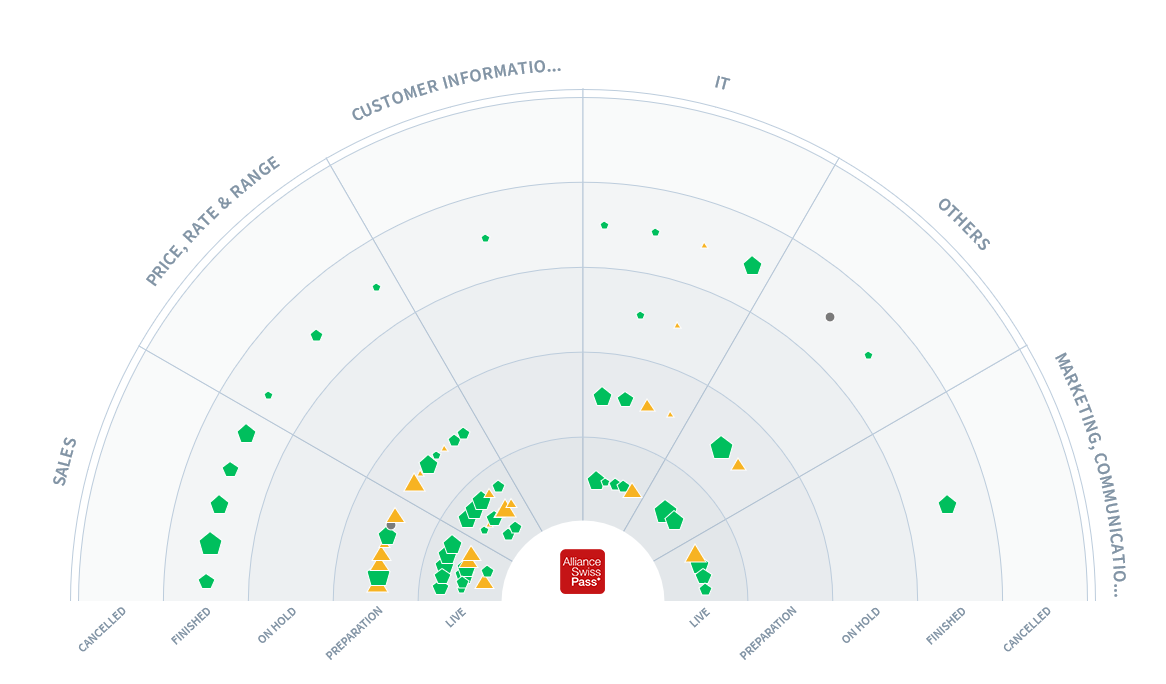
The best real-world examples of working trend radars
Here are examples of trend radars used by different companies for trend monitoring.

.webp?width=845&height=506&name=enterprise-postfinance%20(1).webp)
How to integrate a trend radar into your business operations
To integrate a trend radar, start by aligning it with your business strategy. Identify key areas where trends can inform decision-making, such as product development, market expansion, or risk management.
Incorporate the radar into regular strategic planning and team discussions, ensuring leaders and teams understand its relevance. Use it to prioritize initiatives, allocate resources, and shape innovation roadmaps.
Collaborate across departments to embed trend insights into operations, fostering a culture of forward-thinking. Update the radar regularly and link it to measurable goals, ensuring it remains actionable and supports your business in staying competitive and adaptable.
Start building your trend radar. Today.
The ITONICS Innovation OS provides you with the most interactive and loved radar views. ITONICS is the only foresight software that allows you to connect your foresight activities with ideation and project portfolio management activities. Use it to:
Break down information silos: Consolidate trend insight and engage your experts in the forces that affect the future of the business. The ITONICS Innovation OS empowers teams to centralize intelligence, visualize connections, identify gaps, and spot opportunities.
Share a vision of the future: Embed radars with one click in board-room-ready presentations. Or, get extra engagement from your peers by embedding the radar on an intranet or public webpage. Create a trend radar for everyone to understand and buy into.
Inform decision-making: Jump into collective trend evaluations and aggregate ratings to validate assumptions and gain consensus. Use it to highlight forces of change to stakeholders, inform strategic decisions, and translate trends into action.